I write this last post for Modeling Chemistry as we prepare to go back home. It is just too hot in Arizona that 75℉ is cool here. The air conditioning system is set to 75℉. At home, 75℉ is when I start to wonder about moving to a cooler region of the country…or maybe going to the beach where the water is still very much ice cold. I know that the first post was going to be the last time I complained about the Arizona heat…but I cannot. It is 2-3am and I cannot sleep it’s too hot. But my perception of how hot it actually is might have to do with the fact that I’m ending my first trimester…
U8 WS3
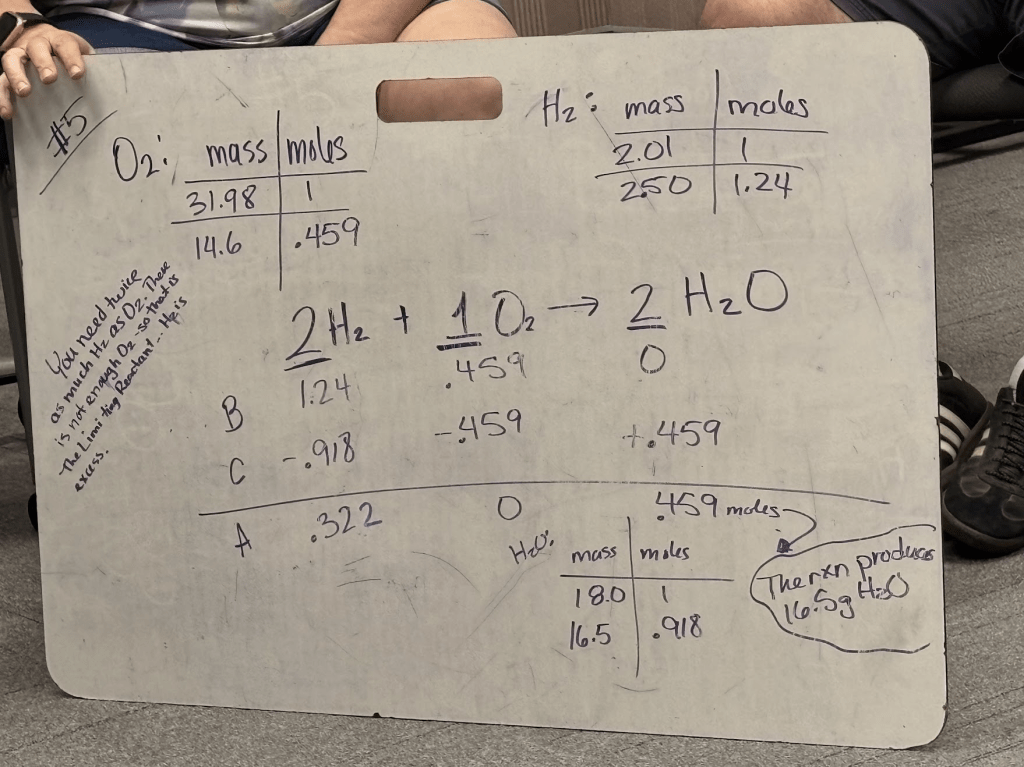
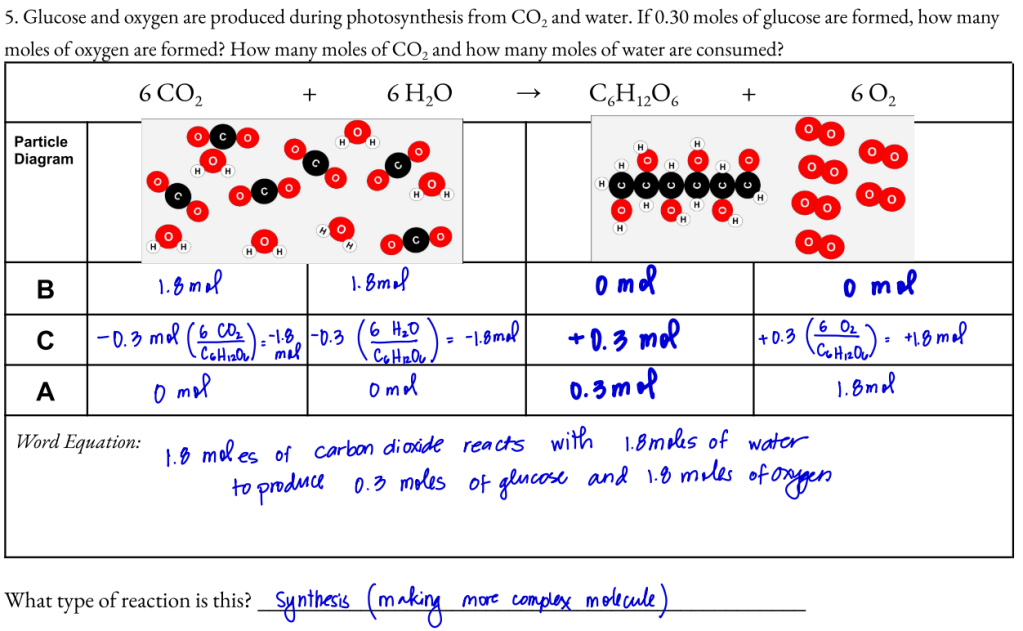
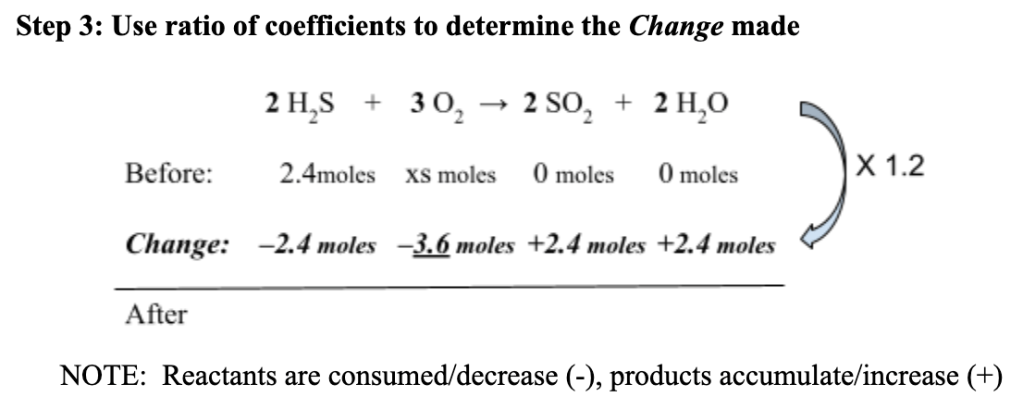
We spent some time working on WS3. It involved drawing particle diagrams, balancing the equation for the described reaction, filling out the BCA table, and writing out the answers. I really liked this approach because of multiple representations and the fact that you don’t actually need Dimensional Analysis to do this. I think I’m going to offer Dimensional Analysis for the students who can do it. For students who have a fear of fraction bars, we can use the Proportional Reasoning tables.
WB WS 2 and WS 3
We spent some time whiteboarding some of the problems. From the discussion, it came out that maybe we needed to be more consistent with significant figures. Some offered what they have their students do and some talked about what they were told as students. I honestly cannot remember what my high school or college Chemistry teachers/professor/TA’s told me. All I know is that I’m slightly fearful of SF.
What comes after Unit 8- Stoichiometry?
Mitch talked about what the units might look like after Stoichiometry. I kind of thought that we were done there, but then Jae mentioned that he uses the Alternative sequence. When I looked at that, I thought that maybe I need to pay attention to it since it closely mirrors what the learning team might want to do. Basically, the ModChem journey isn’t quite over just yet. Looks like I may need to go look at Chem 2 in the near future?
Closing
We finished the workshop out by completing the Reading survey (which ones we liked and which ones we didn’t find so useful). Then, we completed the ABCC survey to determine how much we, the chemistry teachers, have learned. It was basically the same test we took at the beginning of the workshop. As I was completing the test, I realized my own misconceptions about Chemistry. I’m not sure if I’ll administer this to my students next year as I’ll be gone for a part of the year, but maybe in the future!
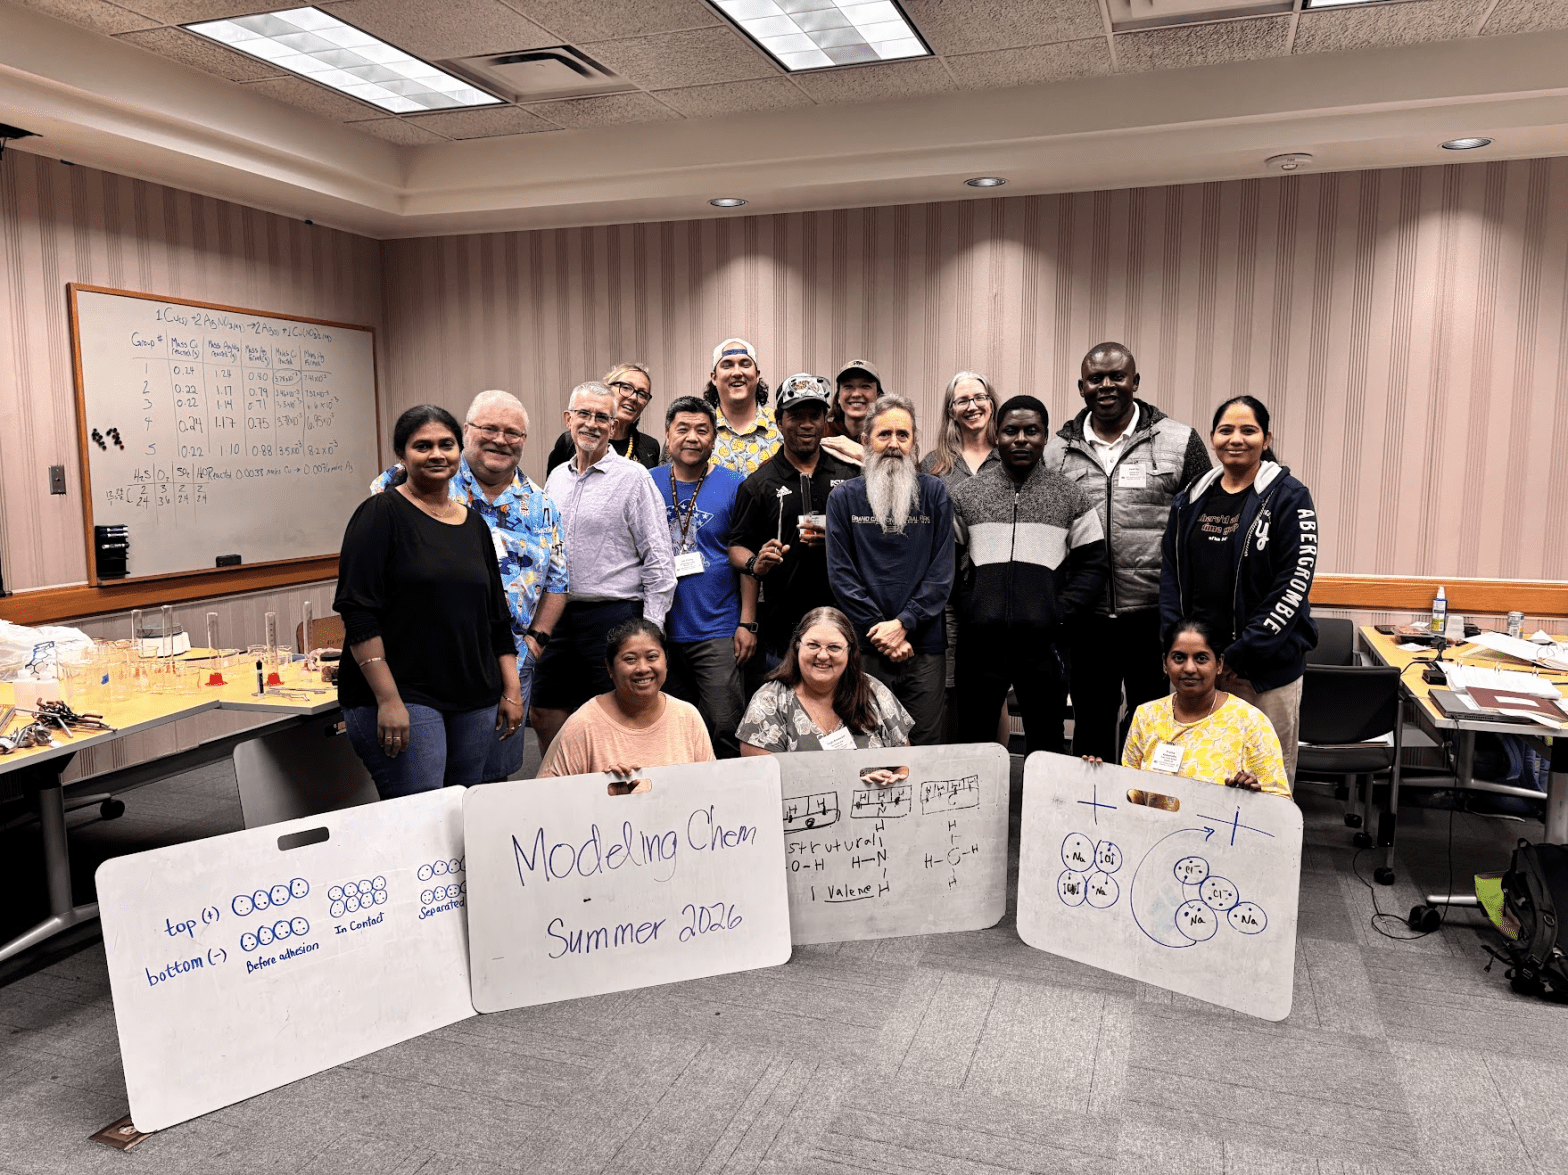
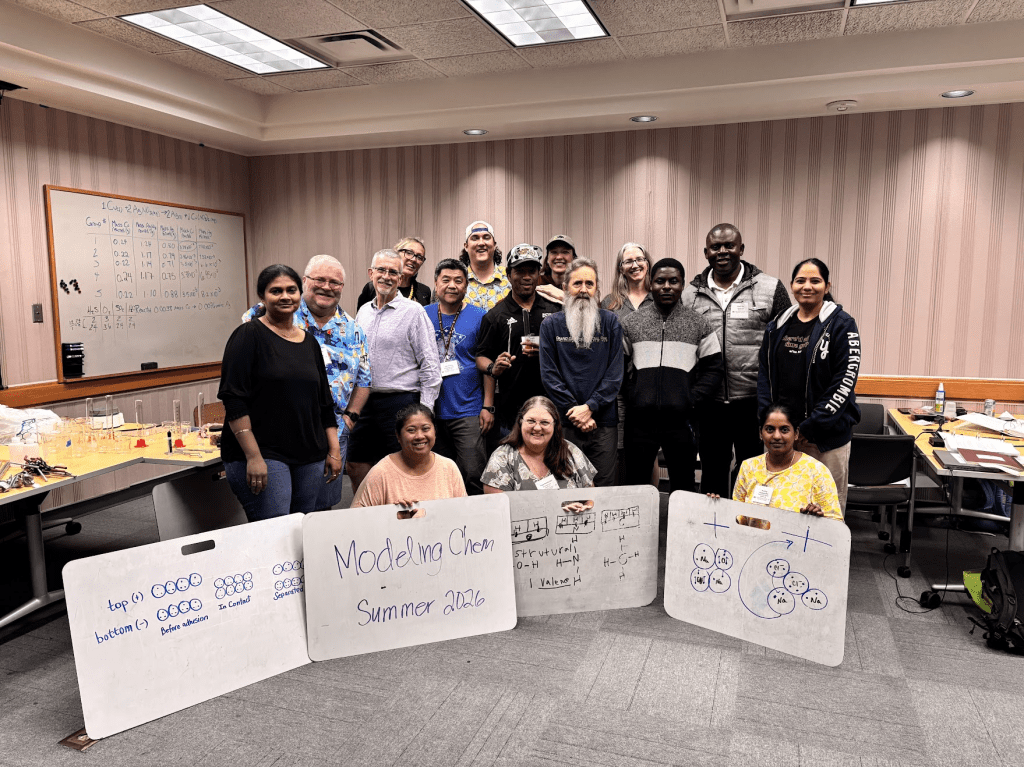
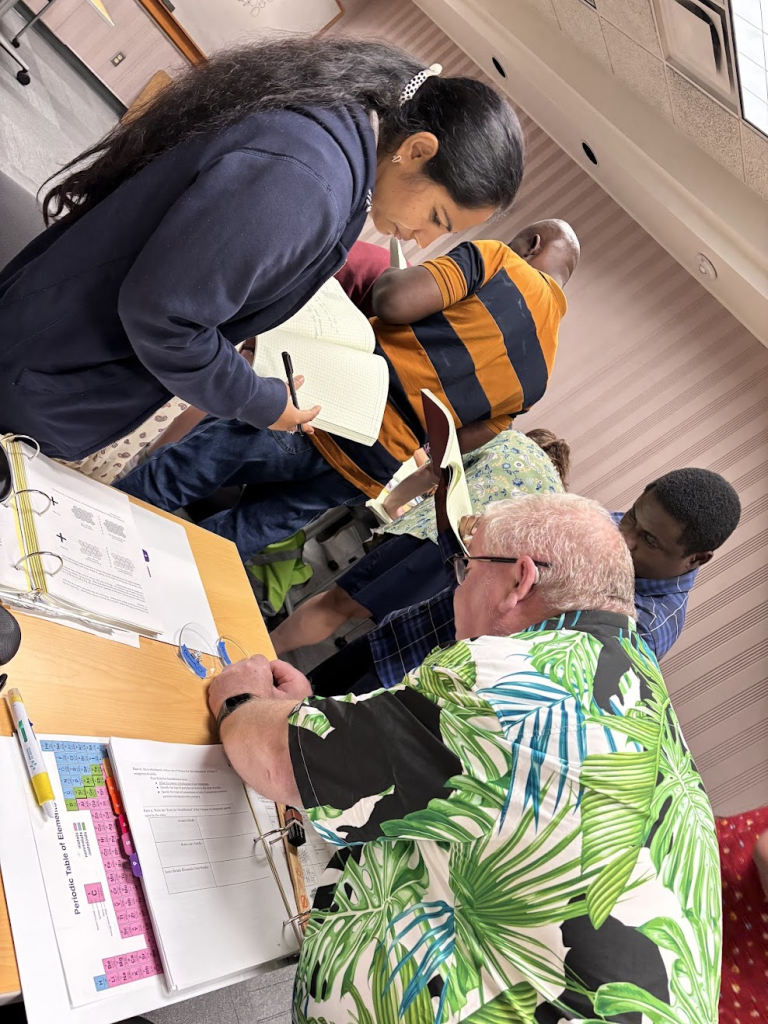
Modeling Chemistry @ASU Summer 2026. I had a lot of fun AND learned so much about Chemsitry with this group. Though I do have our instructors to thank, many offered wisdom and knowledge that I’ll be taking with me. I appreciated that they let me take the group photo!
We started our day by taking a look at our test tubes with the copper wire and silver nitrate. OF COURSE I forgot to take a photo, but just trust me when I say that no more things gathered on our copper wire. Mitch said that that was part of the point. When the silver nitrate gets all used up, no more reaction can happen. We tried to remove any leftover material on the copper wire by squirting some DI water onto it. Then, we decanted our silver and placed it into our initial beaker. All of our beakers were collected to be dried.
U7 Chemical Reactions: Rearranging Atoms
We were lead into a review of some key terms that we had previously discussed. What is matter made of? stuff, but more specifically, particles! We had some rules about particles.
What does Conservation of Mass mean? I have to end up with what I started with. It was pointed out that none of us said: Mass cannot be created or destroyed. We said maybe that specific definition was scared out of us. I do like the statement about starting and ending with the same mass. This makes the definition more real for students. We also defined chemical formula, subscripts in formulas, and coefficients. It was here that we stress that the number of molecules are not conserved. However, both atoms and mass were. Why would atoms and mass be conserved?
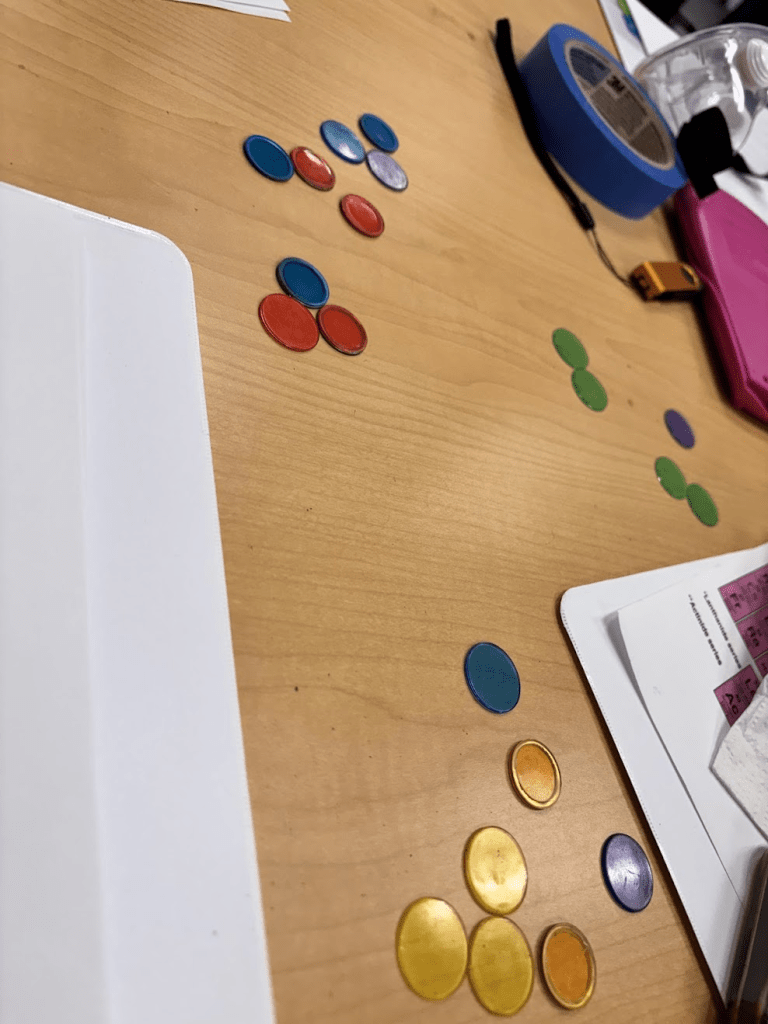
We used these colored discs/bingo chips/math manipulatives to act as our atoms as we balanced equations. I do appreciate that each group had a limited number of chips so that students can see and physically manipulate atoms of reactants being used up to form the products.
Of course, we learned how to balance equations by using the atom inventory or other mathematical means. But it’s fun to be able to see the molecules formed by moving some chips around.
Types of Reactions
I asked when would Types of Reactions be introduced. It would be after completing some balancing equations. Modeling Chem would actually have a lab right about here. Due to time constraints of our workshop, we were unable to do it. I’m writing it here so that I can remember where to insert the lab.
Finishing up the Silver Nitrate Lab
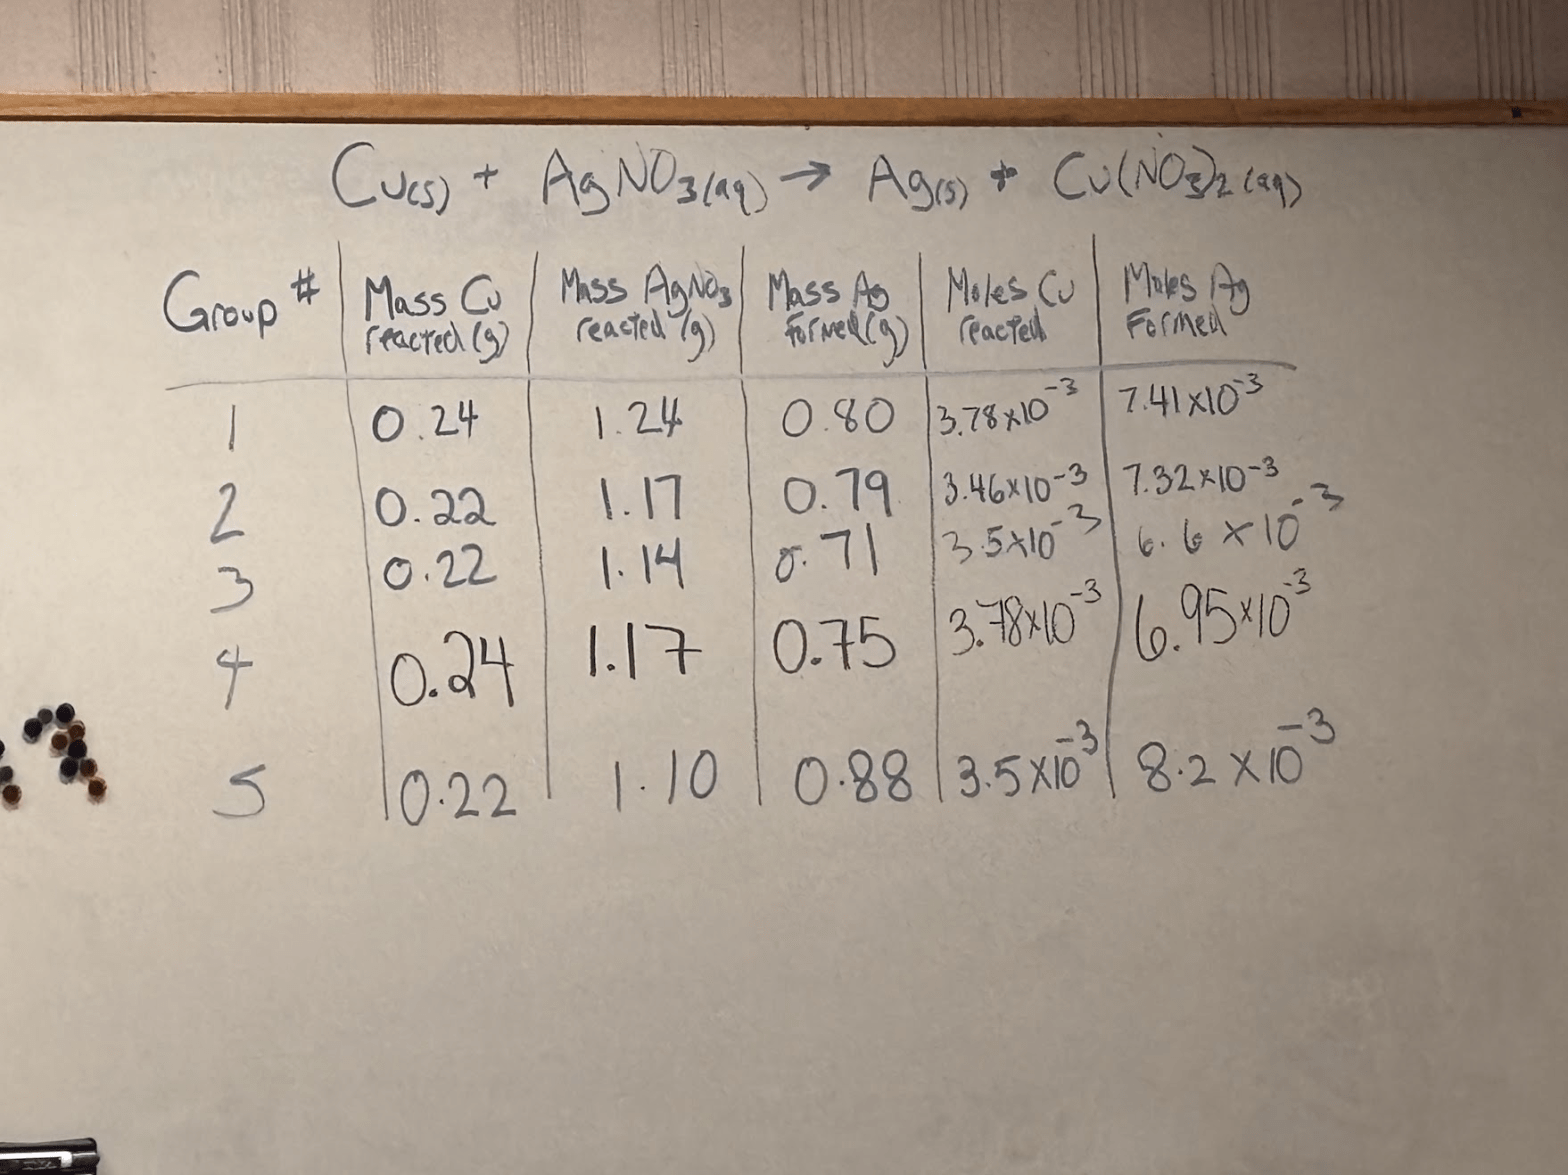
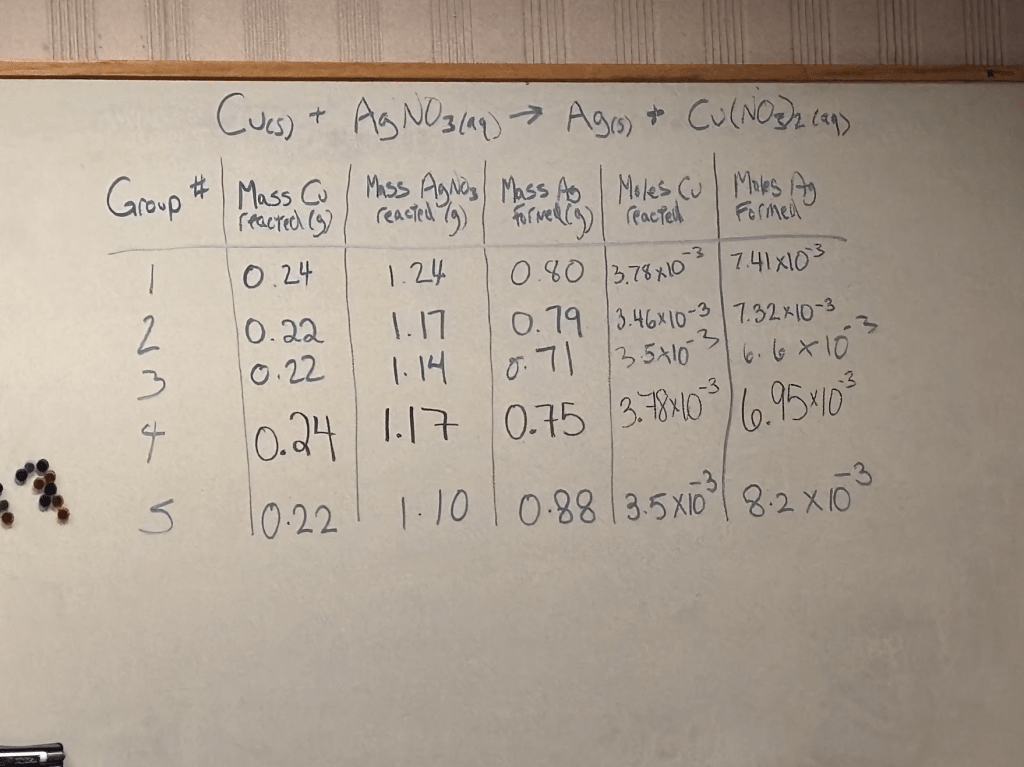
We finished up the silver nitrate lab. I can’t remember now if it was before or after lunch. I spent a lot of time thinking about what time lunch was happening that I wasn’t paying attention to when things were happening. At least I was paying attention to our data and calculating things correctly.
Once again, I forgot to take pictures of our wire and dried silver. Out of curiousity, I wanted to see how much silver per gram was worth today. I think the class collected about $12 of silver. Mitch tells his students that he collects the silver to fund his retirement account. With the amount our summer cohort collected, I’m sure he can retire now…
From here, we saw thqt there was a relationship between the moles of Cu reacted to moles of Ag formed. We saw that the moles of Cu : moles of Ag was about a 1:2 relationship. Our data was roughly about that much. With the number of moles of Cu we started with, 0.00378 moles, we expected to get 0.00756 moles of Ag. Our data shows that it was actually 0.00741 moles collected…pretty good data collection (I think!).
We continued our discussion how the coefficients in the equation would show us the expected ratio of each substance in comparison to another. In this lab, we compared copper and silver. Perfect way to transition to…STOICHIOMETRY!
Mole Relationships and BCA Table
The Modeling Chemistry has the BCA Table introduction come before the BCA Table Reading. Mitch walked us through how to complete the BCA Table. This is very exciting since I taught BCA Table last year. I of course chose the last unit of the year to try the modeling chemistry curriculum materials out. The feedback I received from students is that they largely really liked it.
This was one of the homework problems I assigned to students when starting the Stoichiometry unit for the 2025-26 school year. This is how I understood the BCA table and taught it to students this way. When I learned it, there wasn’t an emphasis on the units part. I added that so that students can easily see where the numbers were coming from. How the Modeling Chemsitry 2026 curriculum approaches the BCA Table.
I learned the new way of completing the BCA table, and it got me all turned around by just having one ratio to multiply everything. The way I learned/taught it–yes, that’s pretty much the same thing. But when students got lost, it was easy to see where they got turned around and how to fix it. We did learn that it’s okay to be uncomfortable. I’m not sure if I’m resisting growth here or if it would be better for my students to see where each number was coming from. The way I initially did would easily lend itself to my favorite dimensional analysis train. The way that Modeling 2026 does it emphasizes the proprotional relationship. I’ll have a while to marinate on this.
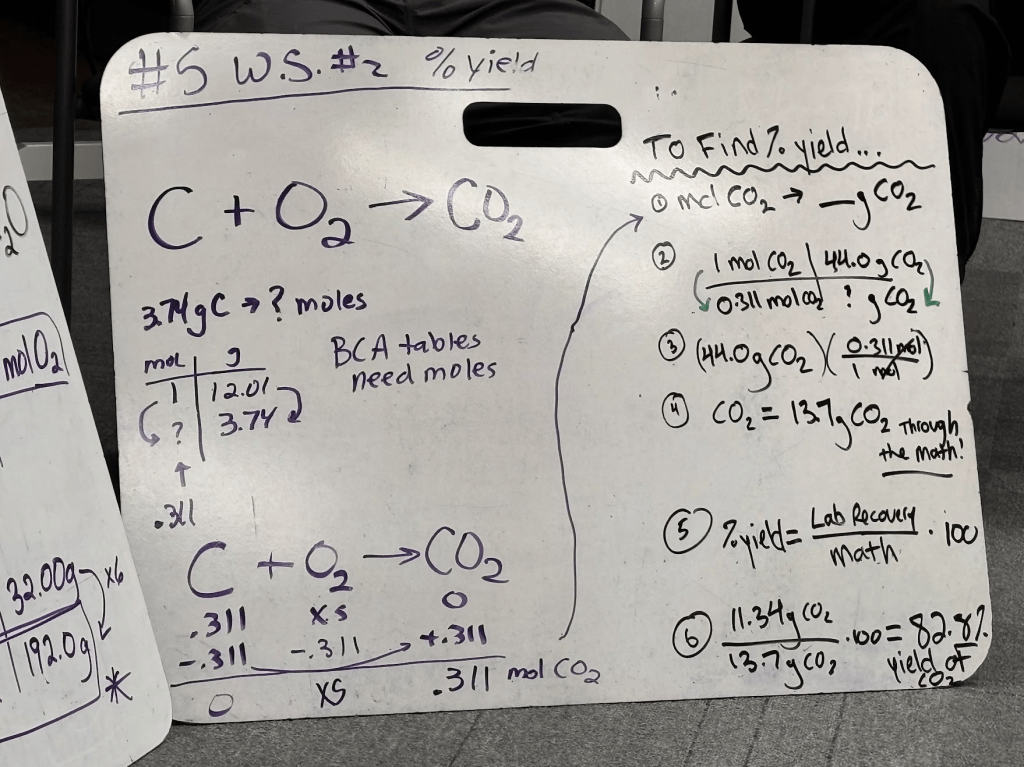
We spent the rest of class working on U8 WS1 BCA Tables and started U8 WS2 Percent Yield. There were some new formatting changes from the 2018 material I was working from. Essentially, the material was still the same. I did ask the class for a group photo. But I think I’ll post that for the last day reflection. It has been a tiring and rewarding experience. Looking forward to hours 86-90 of our ModChem workshop!
An Overview of Recent Research on Multiple Representations – David Rosengrant, Eugenia Etkina and Alan Van Heuvelen is the name of the article we read. We continued the discussion on how learning styles were preferred rather than actually beneficial to learning. Despite the amount of students saying they preferred a certain learning style, the way to meaningful deep learning would be through multiple representations. Modeling Instruction stresses the importance of multiple representations.
U6 WS1: Formula and Particle Diagrams for Compounds
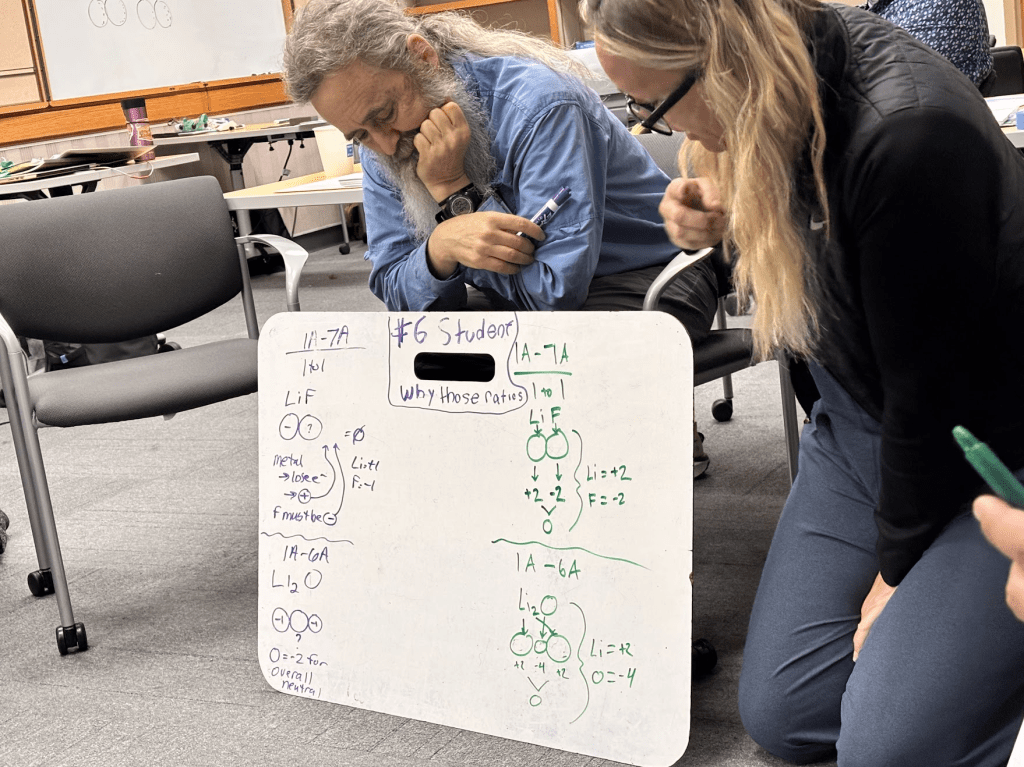
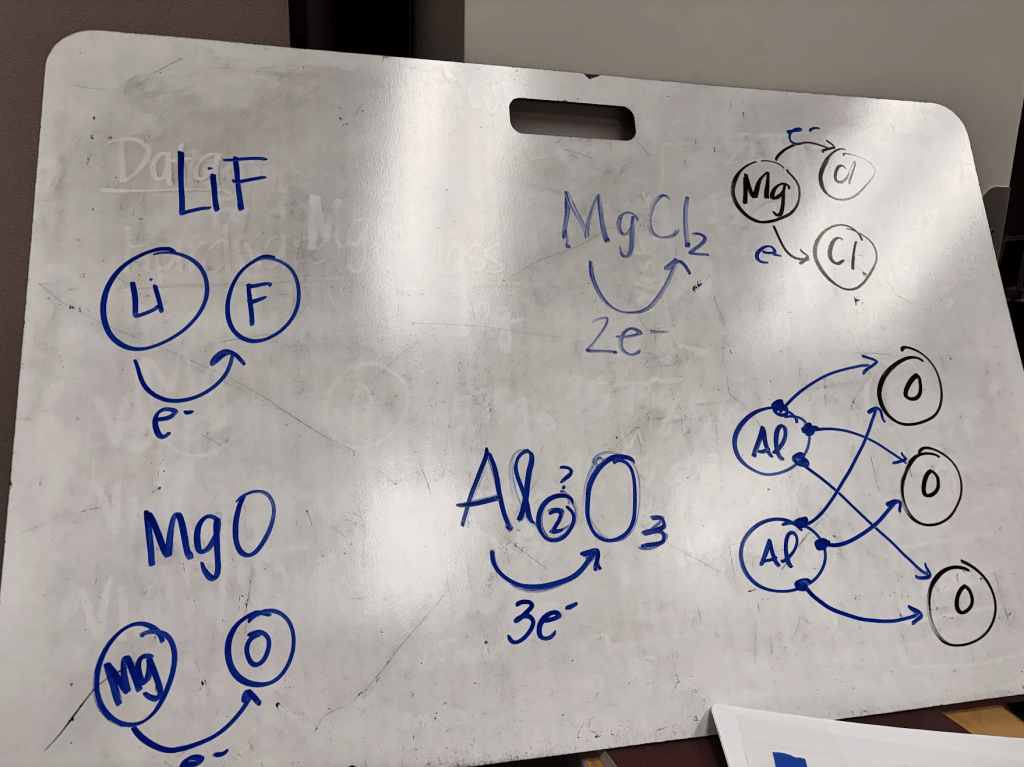
We spent some time exploring our answers. It definitely felt like we are in the last few days of the workshop. Our brains and bodies are tired–the out of towners are ready to go home…and we still have to discuss really difficult things! Trying to make sense of the pattern of the given periodic table was challenging. At the conclusion of our whiteboarding session, it really seemed that the teacher prior knowledge disallowed us from fully engaging into student mode. Mitch and Jae thought that our students wouldn’t be struggling with the concepts we were struggling with. They thought that students might be able to see that MgO, though a 1:1 ratio, would actually have magnesium gives 2 electrons to oxygen.
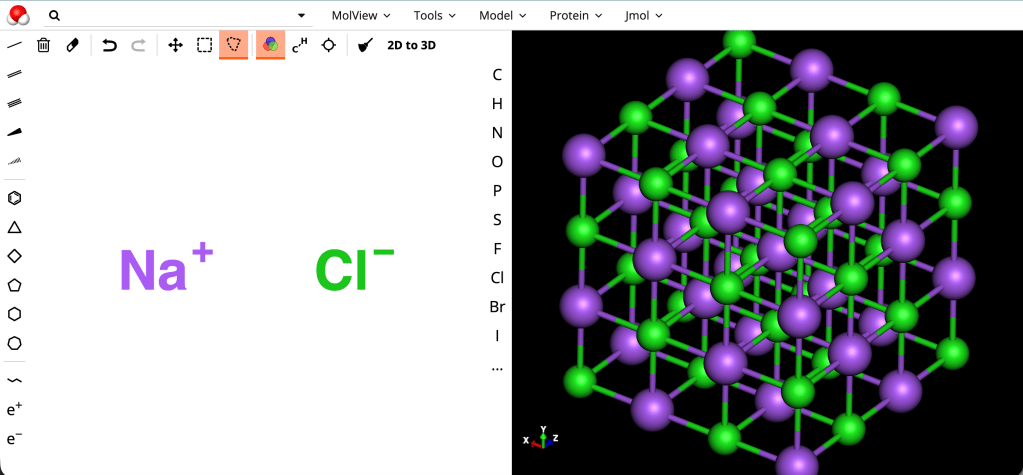
Structures of Solids Activity
We looked at images synthesized by the Mercury software as well as the more student-friendly MolView, online based software. In MolView, you can see the 2D formula representation as well as a 3D rendering. I was actually surprised with how the ionic compounds looked. Then I was reminded that these aren’t actual photographs of the compounds, rather, they were renderings. ::facepalm:: Yes, the instructors repeatedly reminded us that these were renderings. I appreciated the explanation of how we came to name ionic compounds as a formula unit. It personally gave me a better understanding that ionic compounds form a definite pattern, and the formula that comes from it is just the smallest possible unit.
Unit 8: Silver Nitrate Lab
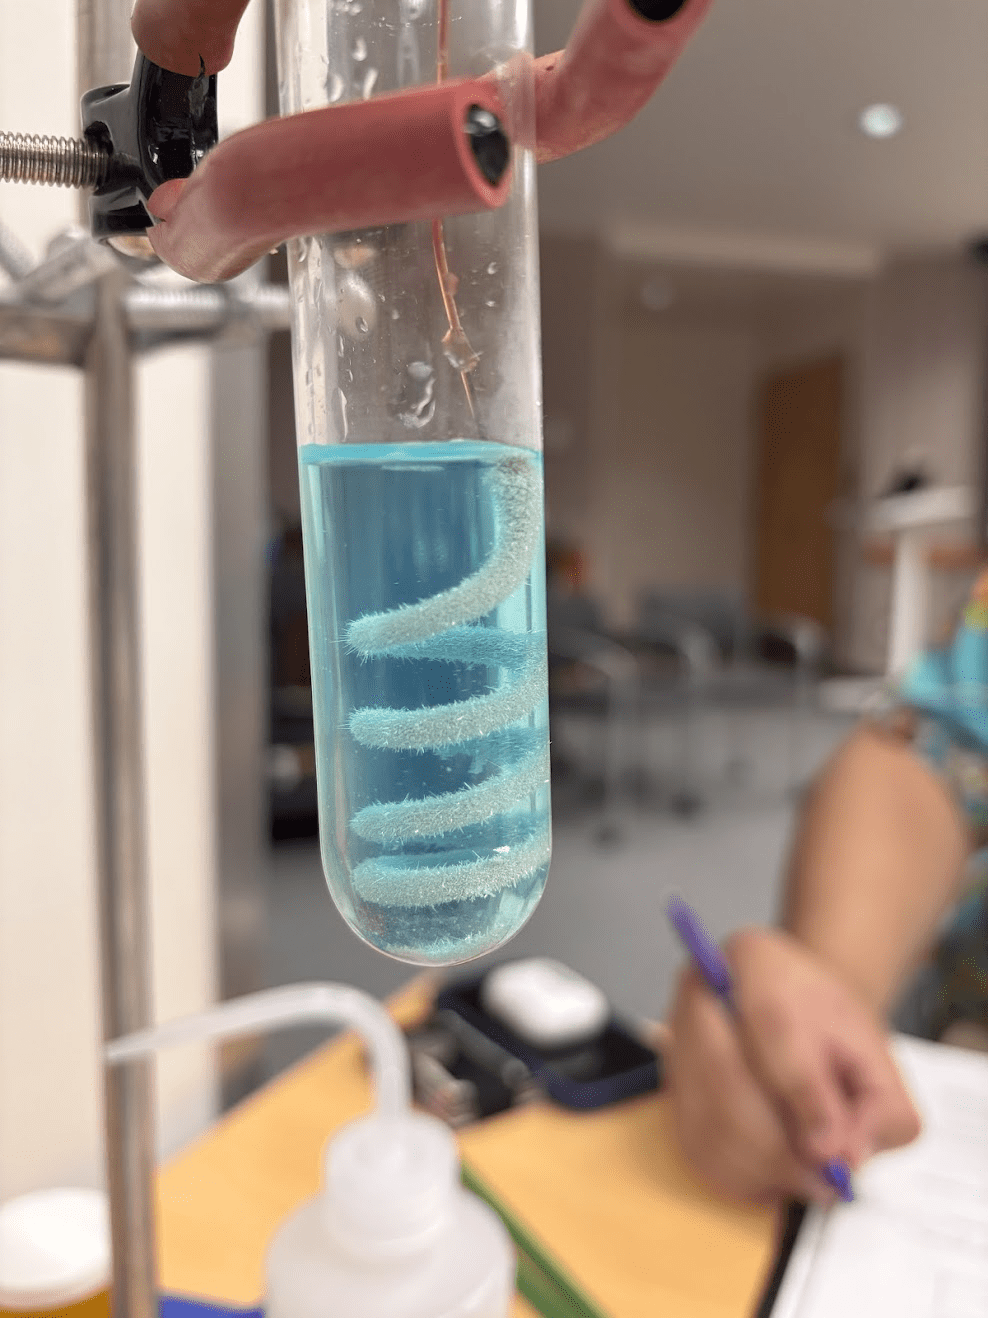
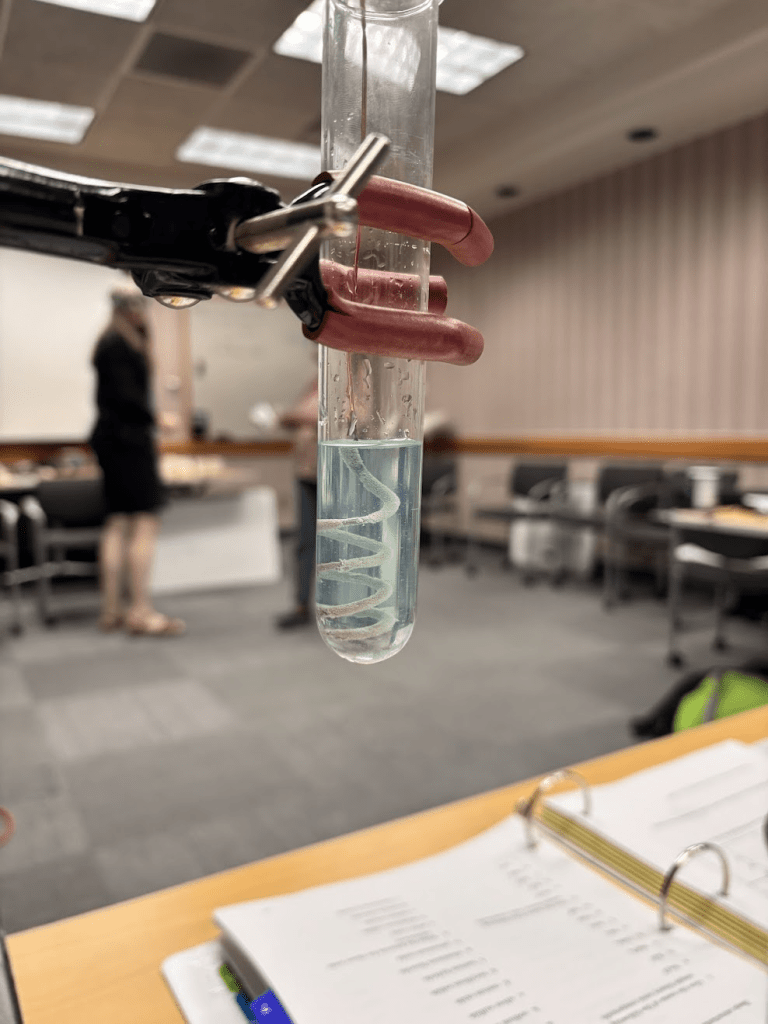
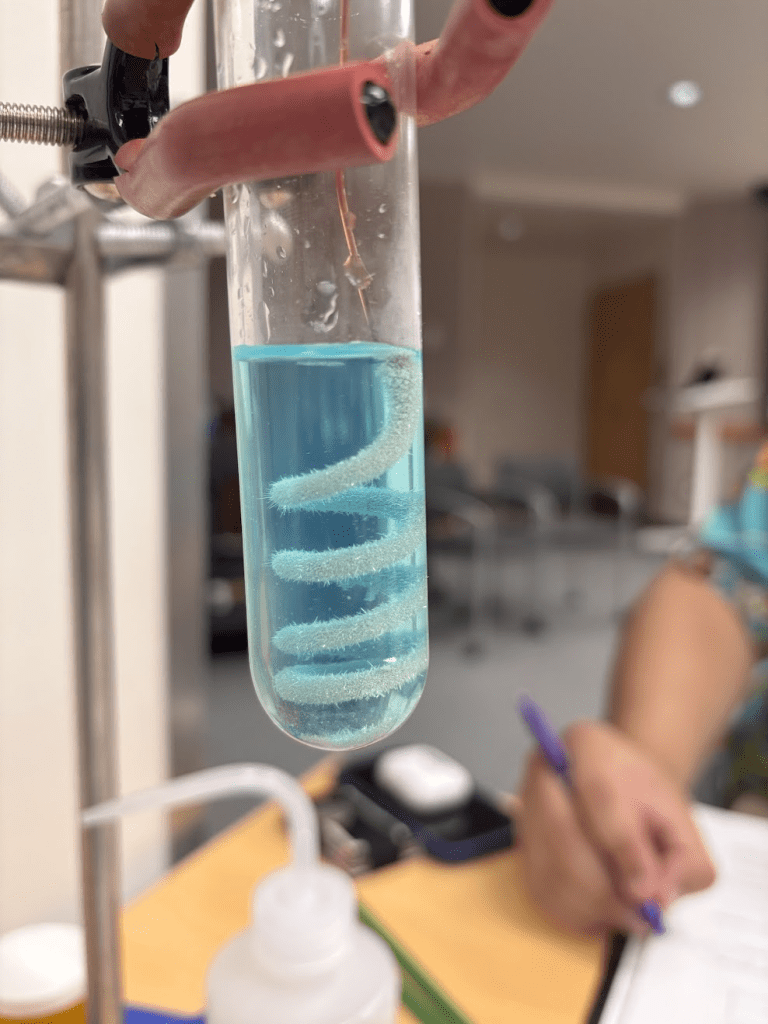
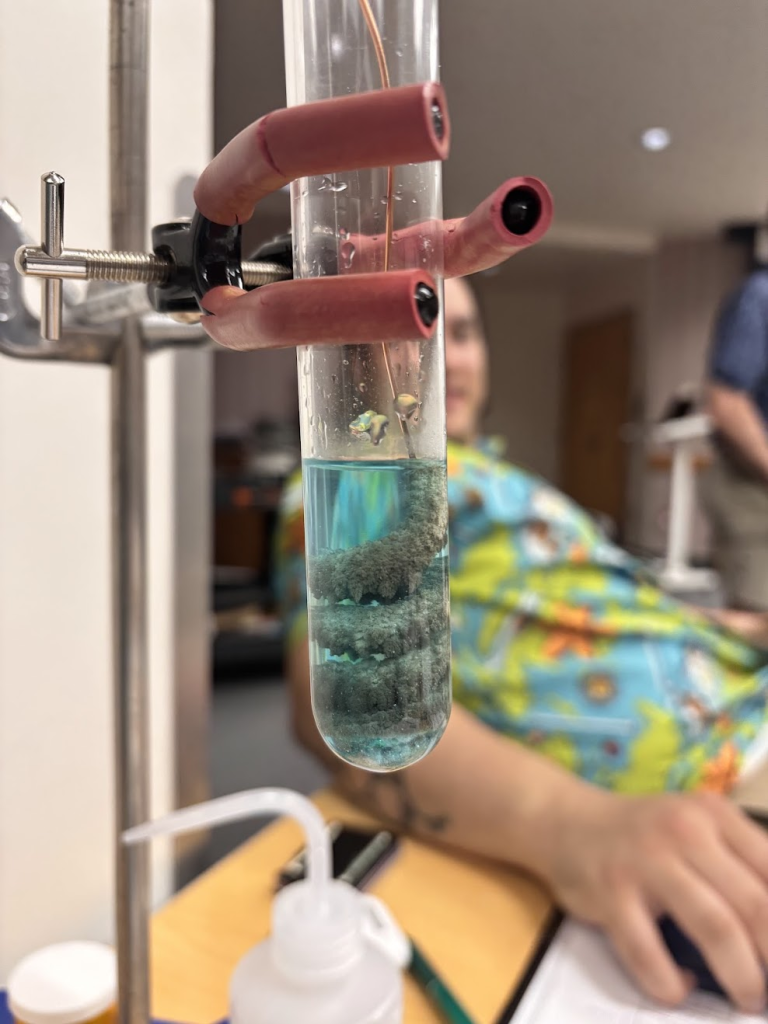
We began the Unit 8 Silver Nitrate lab so that we would have time to let it dry overnight and revisit it tomorrow. The timing of doing this after lunch was brilliant. We all walked to The Chuckbox, apparently an ASU institution, for lunch. But that also meant, we basically had to roll ourselves back to the classroom because we were all so full. We had placed copper wire inside a test tube that had some silver nitrate with distilled water. The progression of it was pretty excitingt o see. There was some fuzzy crystals growing along the wire. Then when we checked on it again, there was a mossy film that kind of looked like algae.
Nail Lab Day 3
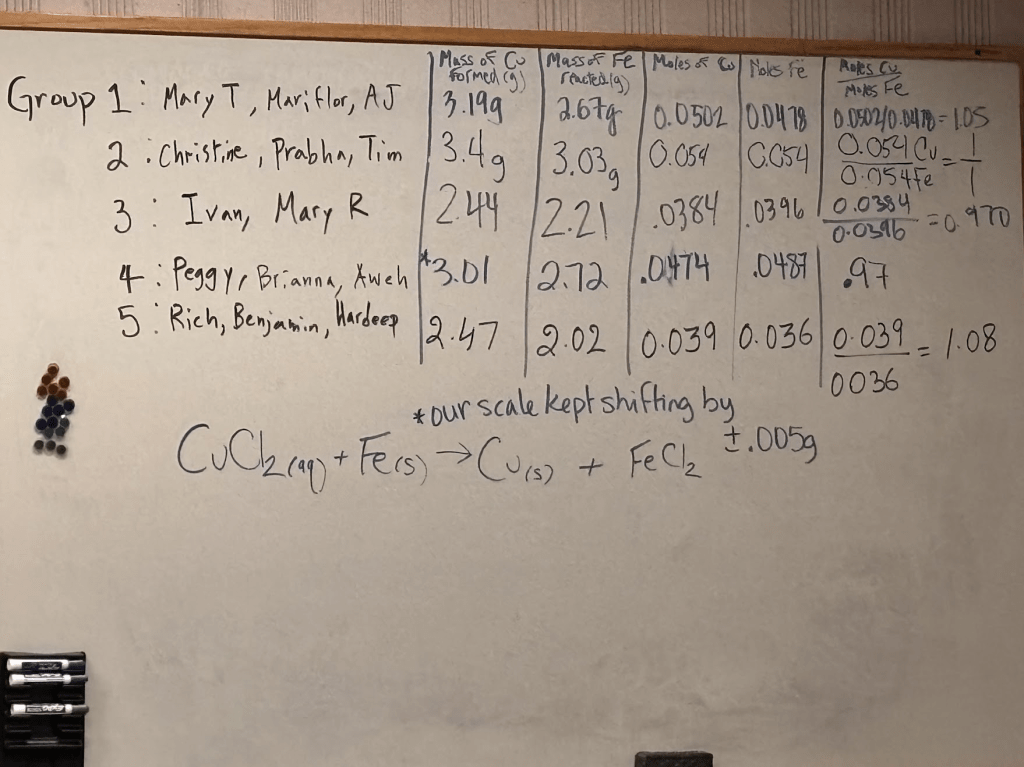
The final day for the Nail Lab (Unit 7). We took a look at the ratio of moles of Cu formed to moles of Fe used. Through our discussion, we discovered that the final product must be FeCl2 because of the ratio of Cu formed from Fe used. Then we went into a long discussion as to why some groups had data that were either above or below 1.00. We were really feeling the afternoon sleepies and asked questions that had Mitch repeating himself. (Sorry, Mitch!) I appreciated the conversation on how to acquire better data because too often, when we ask students to do an error analysis, almost always, they will say- “human error.” At what point did we, as a science teacher community, agree that having students say human error was enough of an explanation?
We appreciated the early dismissal. Some went to the Modeling Mixer at 4 Peaks Brewery. Some, myself included, went home. Just 1.5 more days!
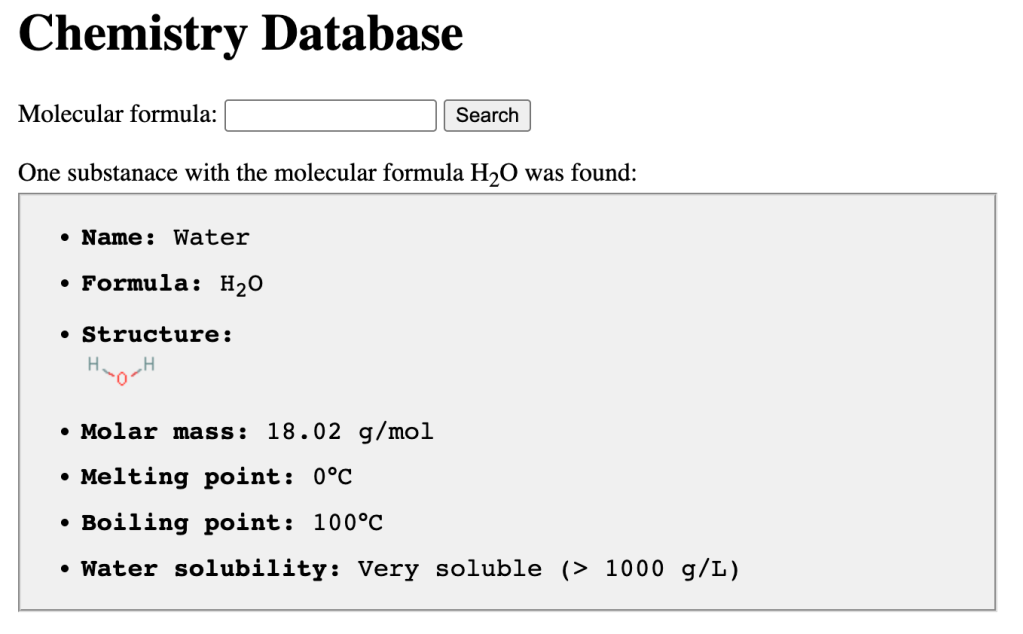
We used an online database to take a look at some properties of a compound.
This is what we saw when went to search for water in the database. We were supposed to take note of some of the properties of water. I asked about the structure and if we needed to look at that, but I was not told not at the moment.
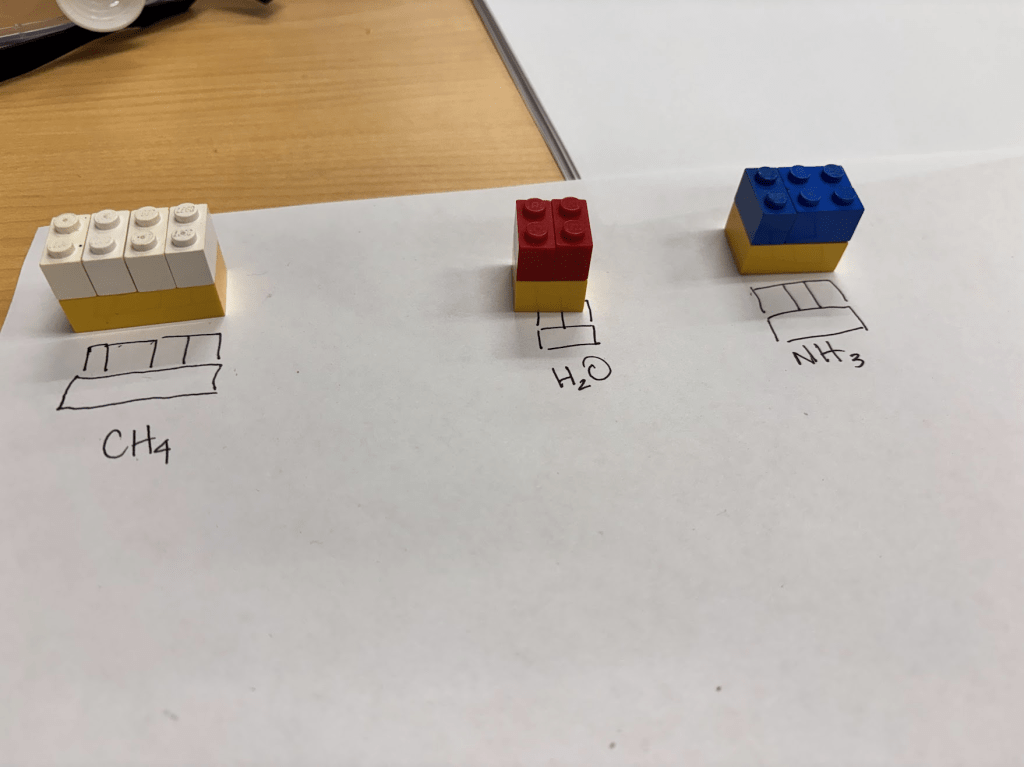
The worksheet then goes on to ask us to develop some models of CH4, H2O, and NH3 using some LEGO brick pieces. From here, our group was to create some rules that we may have had in constructing these models. We determined that the little 2×1 pieces might be hydrogen, and the 2×4 brick might be carbon. That would leave 2×2 is oxygen and 2×3 is nitrogen. We were then to draw the side view of our structure.
Someone asked why it was chosen to use 2xN pieces. In constructing our models, the configurations got a little wonky. Rather than lining them up to face the same way, some bricks were placed sideways. This presented some problems in thinking that hydrogen would then have 2 connections, and that each element might need to have 2 connections (which would mean a double bond).
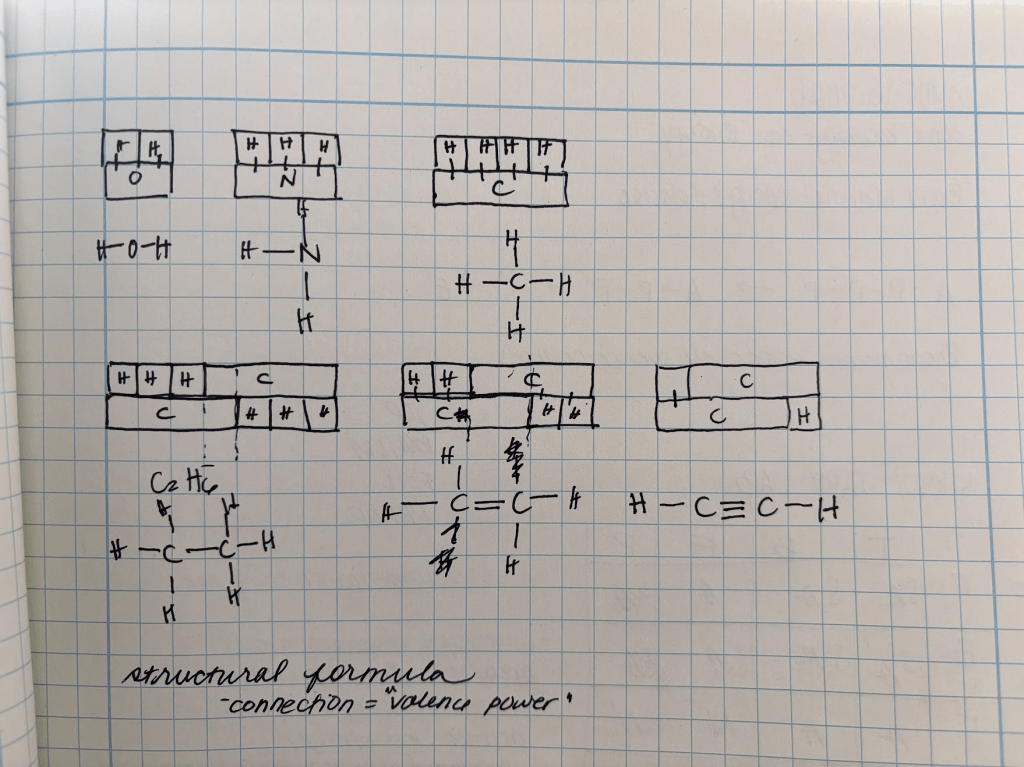
It was overall a great discussion, and I concluded that I might look into using 1xN brick pieces. Luckily, there is a LEGO store near my Airbnb, but also one close enough to my home that I wouldn’t mind driving out and picking some pieces out for this lab/activity. We continued to use the LEGO bricks to make some predictions of what C2H2, C2H4, and C2H6 might look like. One of the rules that the group agreed upon that 1 set of double studs would equal ONE connection. I’m still not convinced that this might lead to a bit more misunderstandings, but I haven’t done it yet–so we’ll see!
We were able to see here that Oxygen had the connecting power of 2, Nitrogen had the connecting power of 3, and Carbon had the connecting power of 4. We then determined that “connection power” is something called “valence.” We didn’t really go into more detail than that at this point.
In creating our hydrocarbon compounds, we were able to see that since the carbon had the ability to connect to 4 things, that it might be able to connect to another carbon more than one time. We did call them double and triple bonds, but no more explanation. Maybe there was, but it’s the last week of the workshop–the fatigue is starting to settle in.
Days 1 & 2 of the Nail Lab
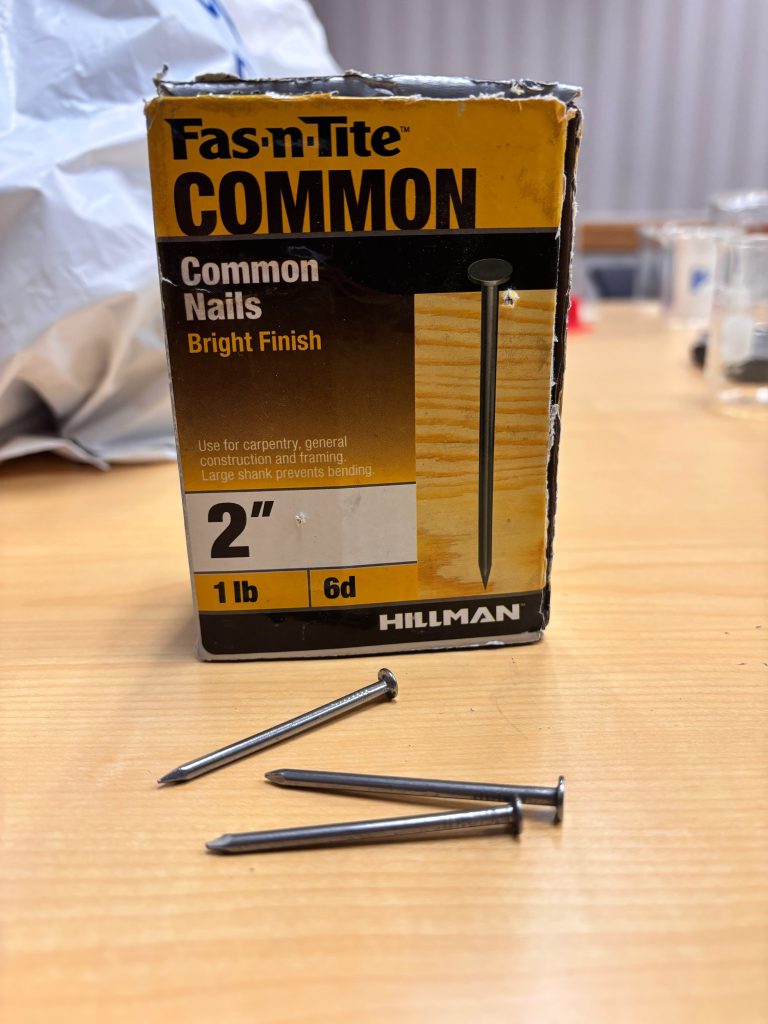
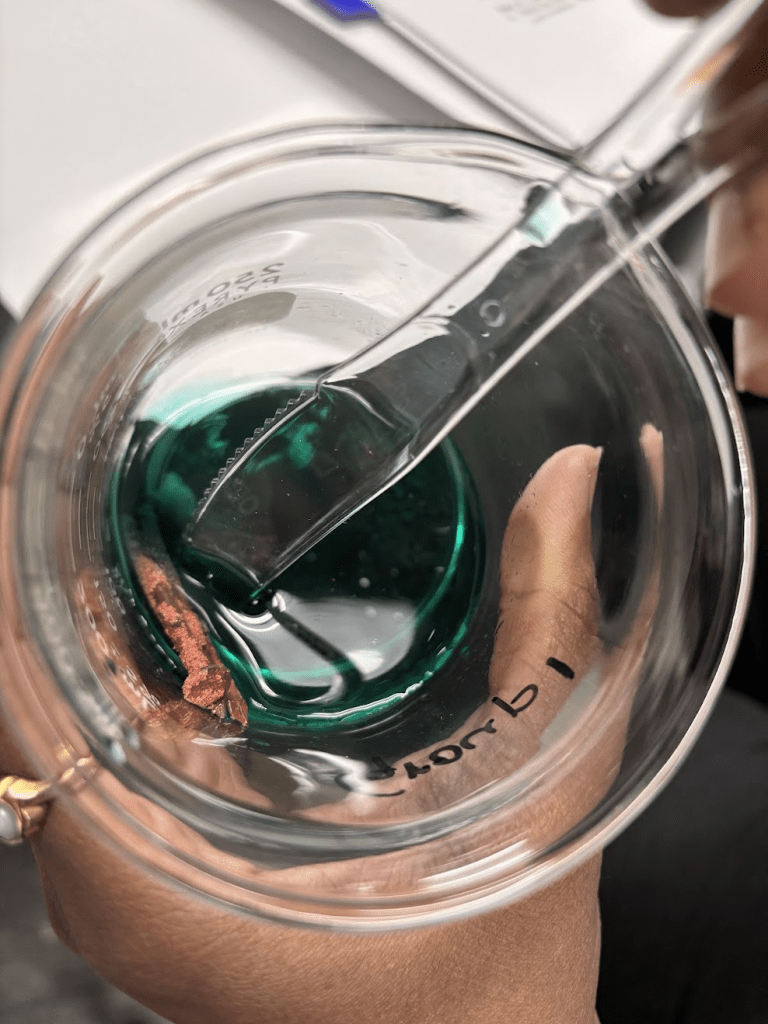
We started the Unit 7 nail lab while finishing up Unit 5 because it takes a couple of days to accomplish. First, we massed 3 nails and placed them into a copper (II) chloride solution. I didn’t get a chance to photograph it, but the color was super blue at first, then it turned a really pretty dark green. Then, we let it marinate to the side and went on.
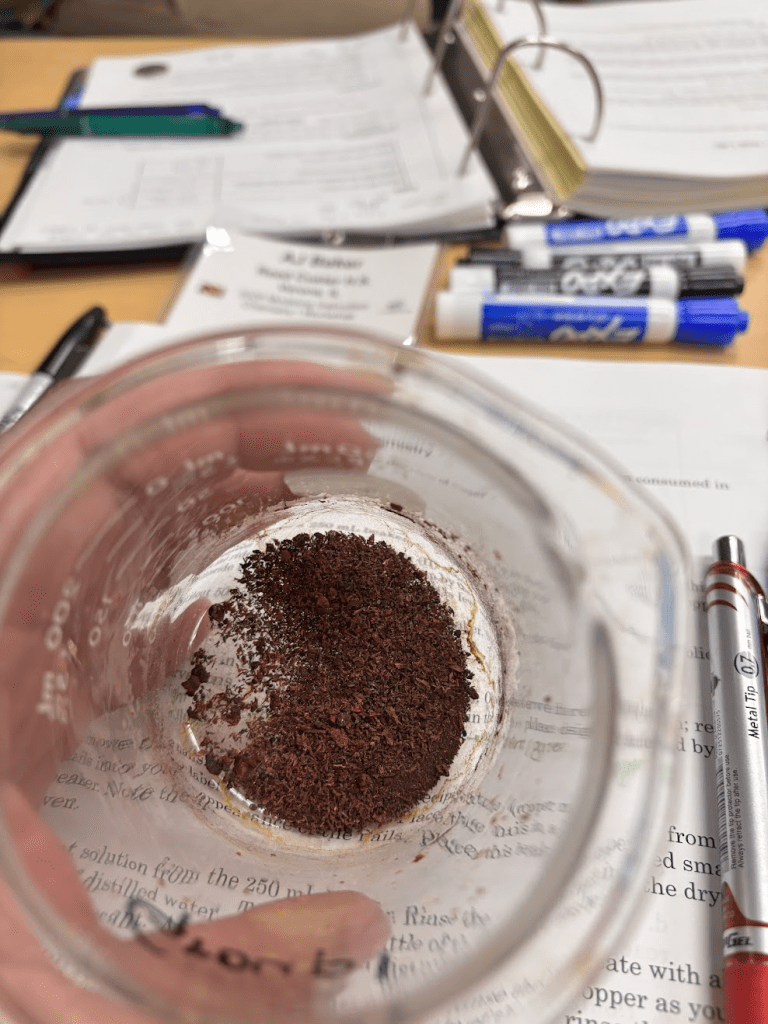
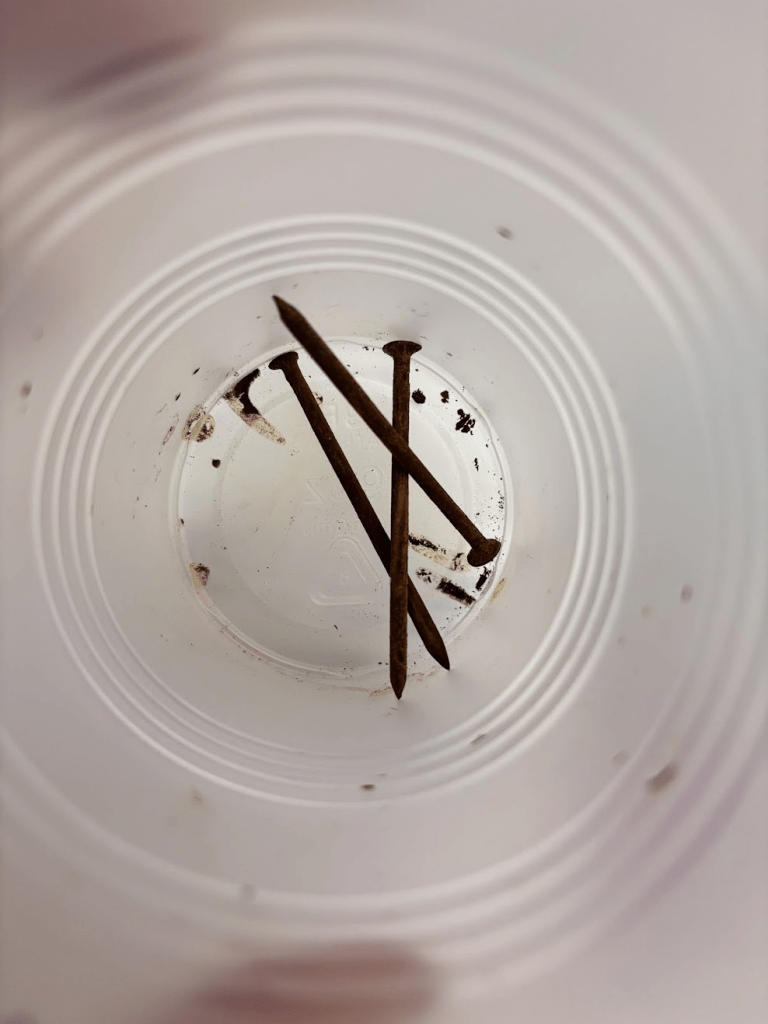
For Day 2, We have now let our nails soak in the copper (II) chloride solution. We saw that the solution turned a really murky color and that some orange-brown colored sediment settled at the bottom of the beaker. We took the nails out using some tongs and placed them into a plastic cup. We rinsed it out a bit and set it to the side. Then, we decanted the solution in the beaker using water, water, HCl, and then water.
Exothermic Bond Breaking: A Common Misconception
I think this was at the beginning of Day 12, and we started with a discussion on the Galley reading. It was about the misconception that Energy is a product of ATP becoming ADP. Rather, it is in the breaking of the bonds where it cost energy. The energy release comes from the making of the bonds. However, now that I’m writing this from memory, I don’t quite remember which bonds are being made. The reason that the ATP –> ADP is an exothermic reaction is in the making of the bonds. Most of us learned that the exothermic reaction came from the breaking of bonds. There was some learning and unlearning that most of us modelers had to do.
U6 Sticky Tape Lab & Debrief
When I first started teaching Physics (10 years ago!), we used to do the Sticky Tape Lab as the intro to our Electrostatics unit. I’m kind of sad that we don’t make it to Electricity anymore, but never say never! Maybe we’ll get a chance to do it again!
Mitch had an EXCELLENT delivery of the charges moving from atom to atom. It involved my historic enemy, Ben Franklin. I used to give a whole shpeal to students hoping to inspire them to be one of the Physics bigwigs and convince the world to stop teaching electricity backwards (as positive ions) moving through a circuit..and how it’s actually Ben Franklin’s fault. But Mitch did so without putting any blame on him and giving JJ Thomson his flowers. I might ask Mitch to record his speech or request his script for this part. It was also at this point that I realized that the “Plum Pudding Model” was not like the Jello pudding I love. Rather, it is like bread pudding. This realization lead to more questions than clarification. Like why would JJ Thomson make that comparison when he said that there are electrons (plums) moving through the atom (pudding)…WHEN the plums do not move in the pudding? Maybe I still do not understand what plum pudding actually is.
Conductivity Test
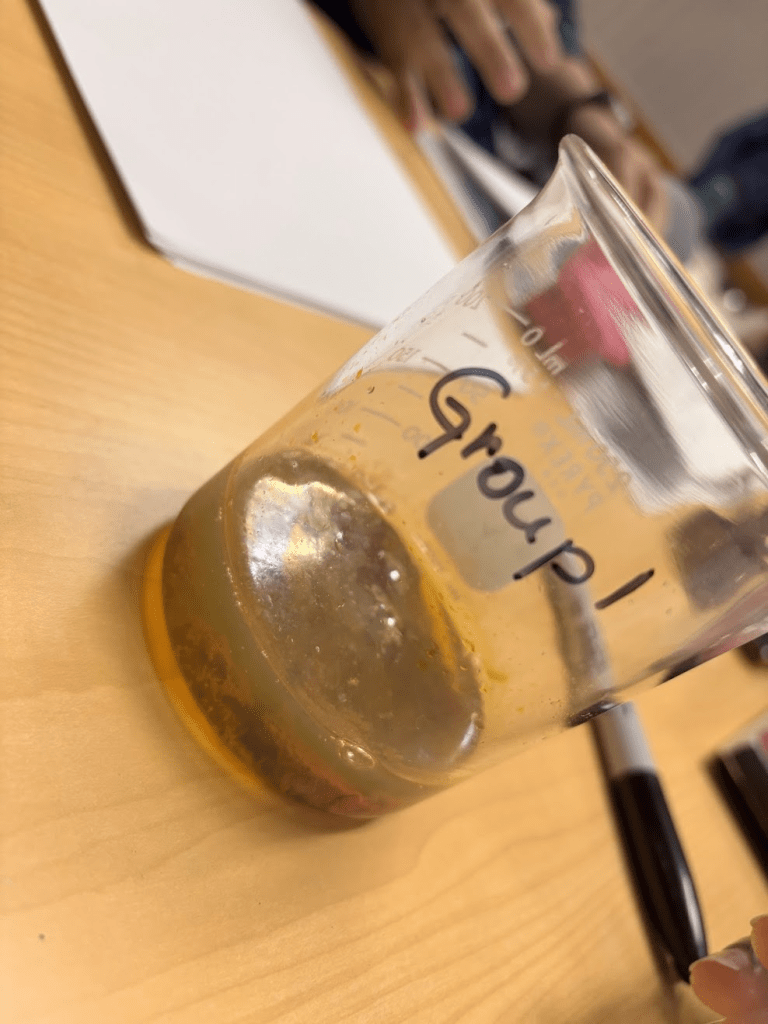
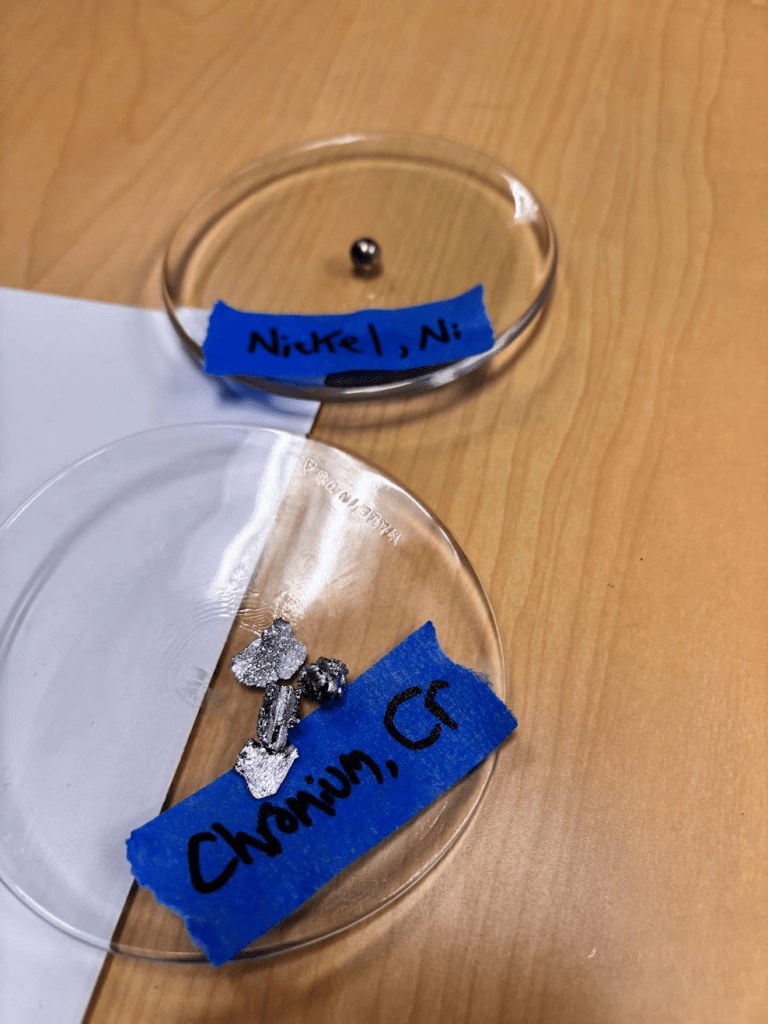
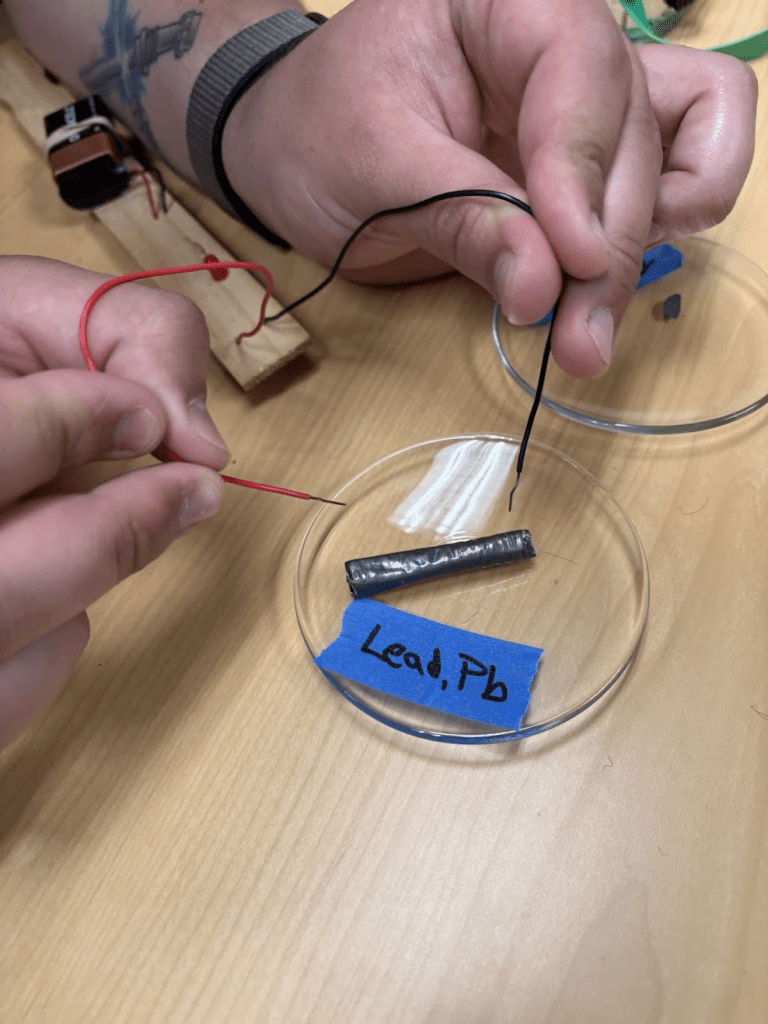
The Conductivity Test Activity wasn’t in the binder (I think), but we went around and test various items. Part 1 was testing a bunch of solid elemental objects. Part 2 was testing some solid compounds specifically: sodium chloride, copper sulfate, sugar, isopropyl alcohol (aq) and water(l). Part 3 was testing compounds in solution: sodium chloride, copper suflate, sugar water, isopropyl alcohol with water, and ammonium nitrate with water. We had a discussion of What does this conductivity thing really mean?
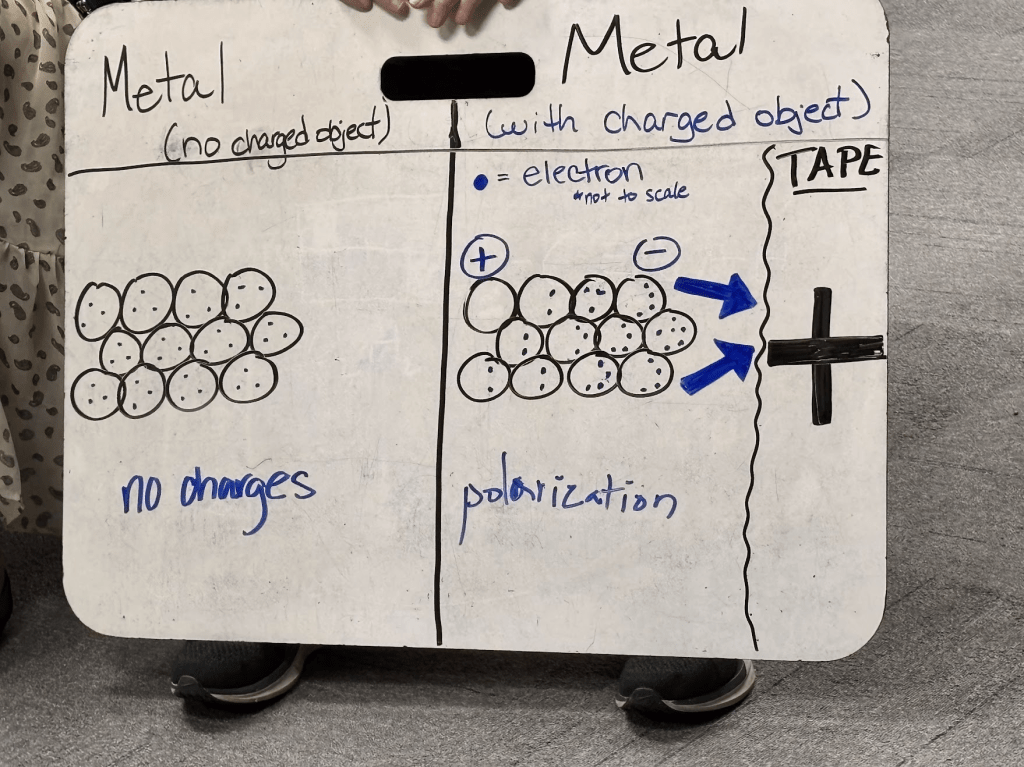
This lead into whiteboarding! Yay! More whiteboarding! Since we were nearing the end of the workshop, and we were tiring of the Board Meeting, the workshop leaders switched it up by having a 1-2 groups present electron movement in the Top tape and Bottom tape..and how that might relate to our discovery of metals, nonmetals, and things in solution. We agreed on some particle convetions like 3 dots in an atom particle means that it’s neutral. Less than three dots would mean that it would have a positive charge, and greather than three dots would indicate a negative charge.
This picture shows the polarization of atoms within a metal. There is one atom with no electrons. I can’t remember if we were corrected that we should never leave a particle with zero electrons, because atoms will always have electrons. I mean we must have if I remember it?
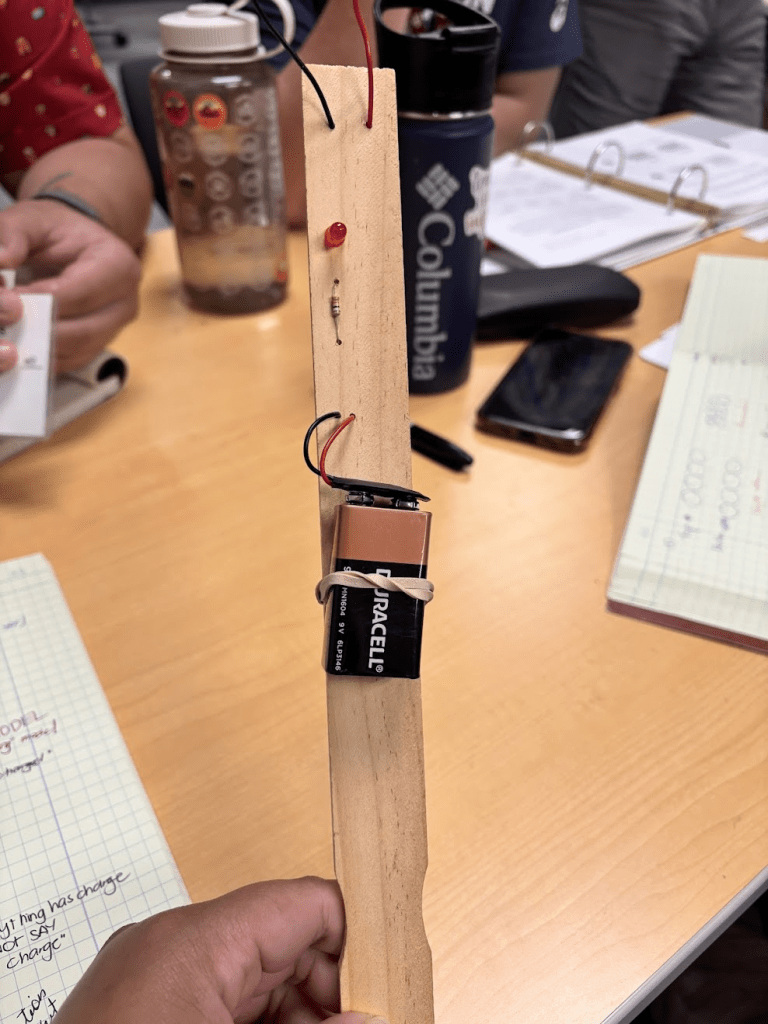
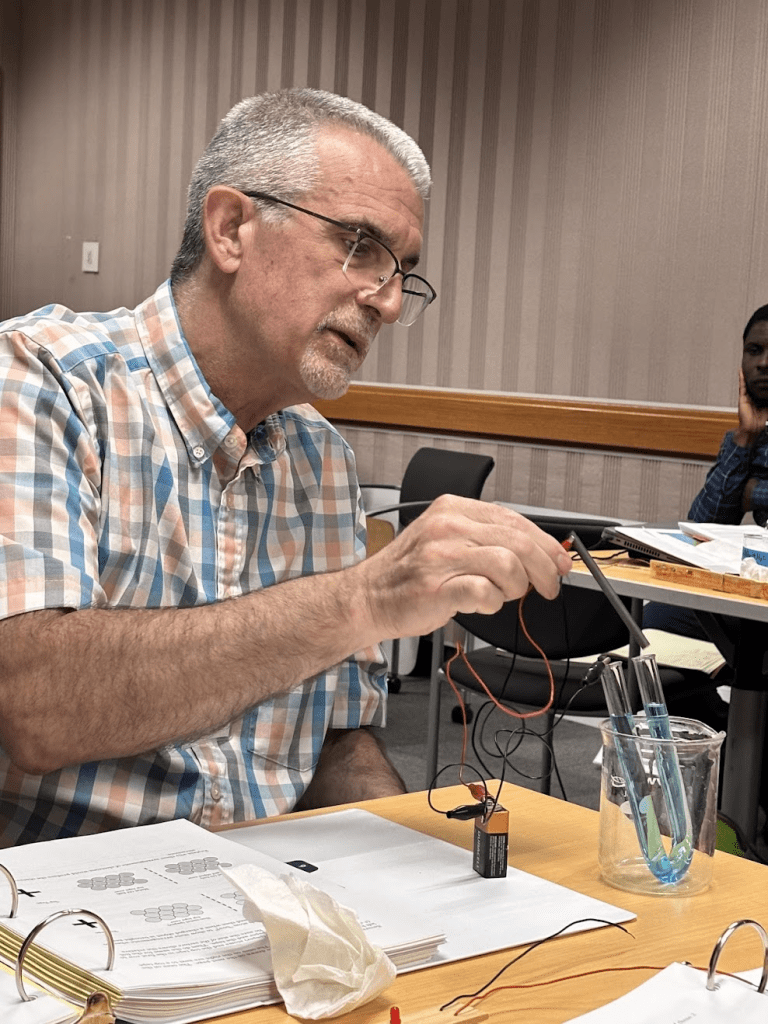
Electrolysis of coppuer (II) chloride
We ended the day with Mitch talking to us about the original u-tube…had to include that Dad joke in there with the week’s proximity to Father’s Day. Basically, we found that the graphite, when powered by a battery, had bubbles forming around the end connected to the positive terminal. The graphite connected to the negative end was plated with copper. We talked more about electorn flow and some evidence that the electrolysis was working. The smell of chlorine gas started wafting through the air, and we deduced that the bubbles forming were chlorine. Mitch emphasized that the chlorine gas floating was neutrally charged. The substance plating the other end must be copper. Therefore, copper must be positive charged and chlorine must be negatively charged.
We had a pretty spirited conversation about the use of Learning Styles in education. So much funds and monies have been spent on workshops, resources, etc. to incorporate learning styles in the classroom. As an undergraduate student, I do remember one of my Psych professors saying that people may have a preference for a certain kind of learning method, but it is certainly not an excuse to ignore the other modes. This just led to confirm that Modeling Instruction is so valuable because we ask students to represent their learning through multiple modalities. In every representation, the story needs to tell the same thing…and it is pretty fascinating that students often cannot get their representations to reconcile.
Unit 4: WS 1- Mixtures and Compounds
We completed and discussed WS1. In order to save on time, we did not execute a Board Meeting to tease out important learning objectives. It is at this point that students will need molecule, elements, compounds, pure substances, and mixture defined. We were given a series of particle diagrams and we had categorize the diagrams into element or compound, pure substance or mixture. I can now appreciate some of the ambiguity that some of the diagrams had so that you can elicit conversations from students.
Unit 4: WS 2- Avogadro’s Hypothesis
At the same pressure and volume, the gases contain the same amount of particles. We had a hard time with this worksheet because it was tough to see that each volume of gas would all create one volume of gas. So, we kept going back to the statement: At the same pressure and volume, the gases contain the same amount of particles. We watched the video: Chem Study: Gases & How they Combine to help us see solubility of gases.
Dalton’s Playhouse
Dalton’s Playhouse showed us how an experiment may have been carried out to lead Dalton to the development of his atomic model.
Unit 4: WS 3 & WS 4
We were BLASTING through Unit 4. We worked on on WS 3 and WS 4, and then it was the end of the day. I really liked how we had to set up the mass ratios to figure out what the ratio of each element might be in a chemical formula. I’m foreseeing that it might be hard for students to see the ones that aren’t exactly clean. For example, (numbers not from the worksheet) 0.83 and 1.66- I’m not so sure students would be ready to see that’s a 1:2 ratio. I’m worried about when it gets to 3 or 4 too! Number sense is SOOO important.
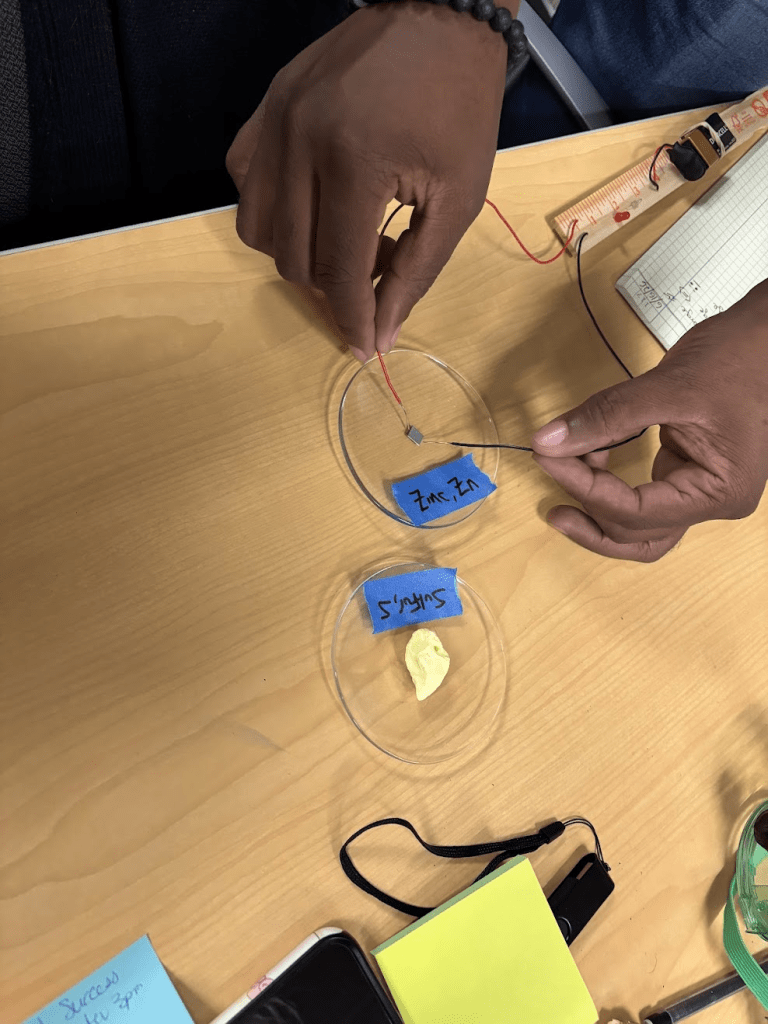
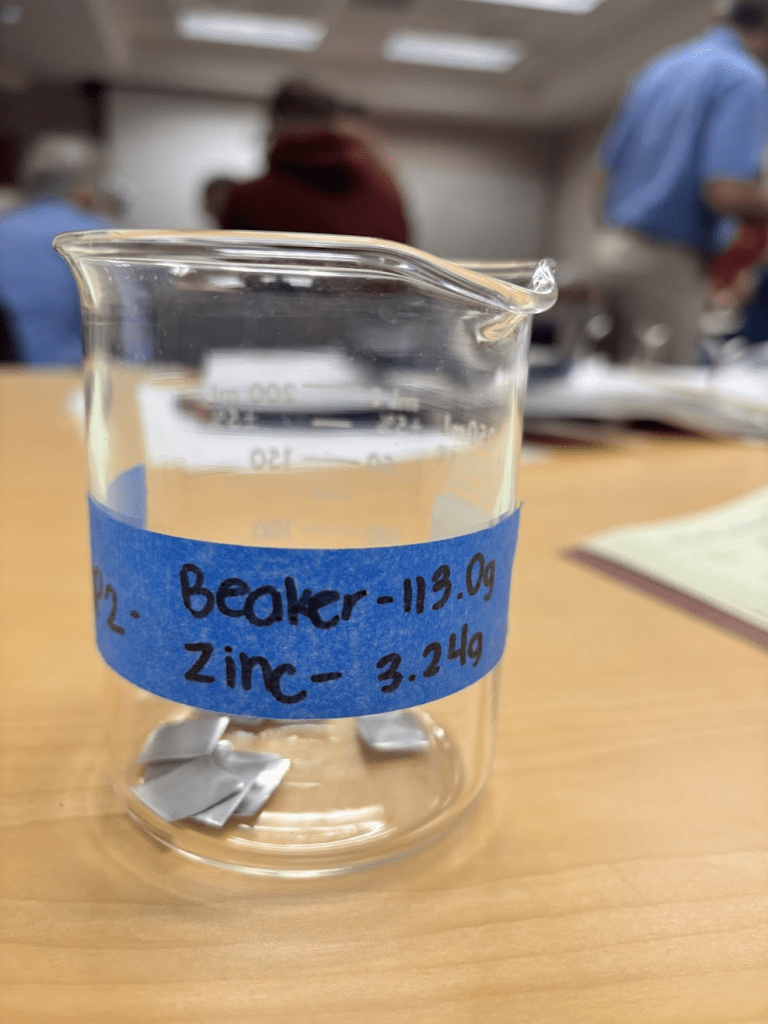
We started the zinc lab so that Mitch can have time to boil the excess liquid and dry the leftover solids.
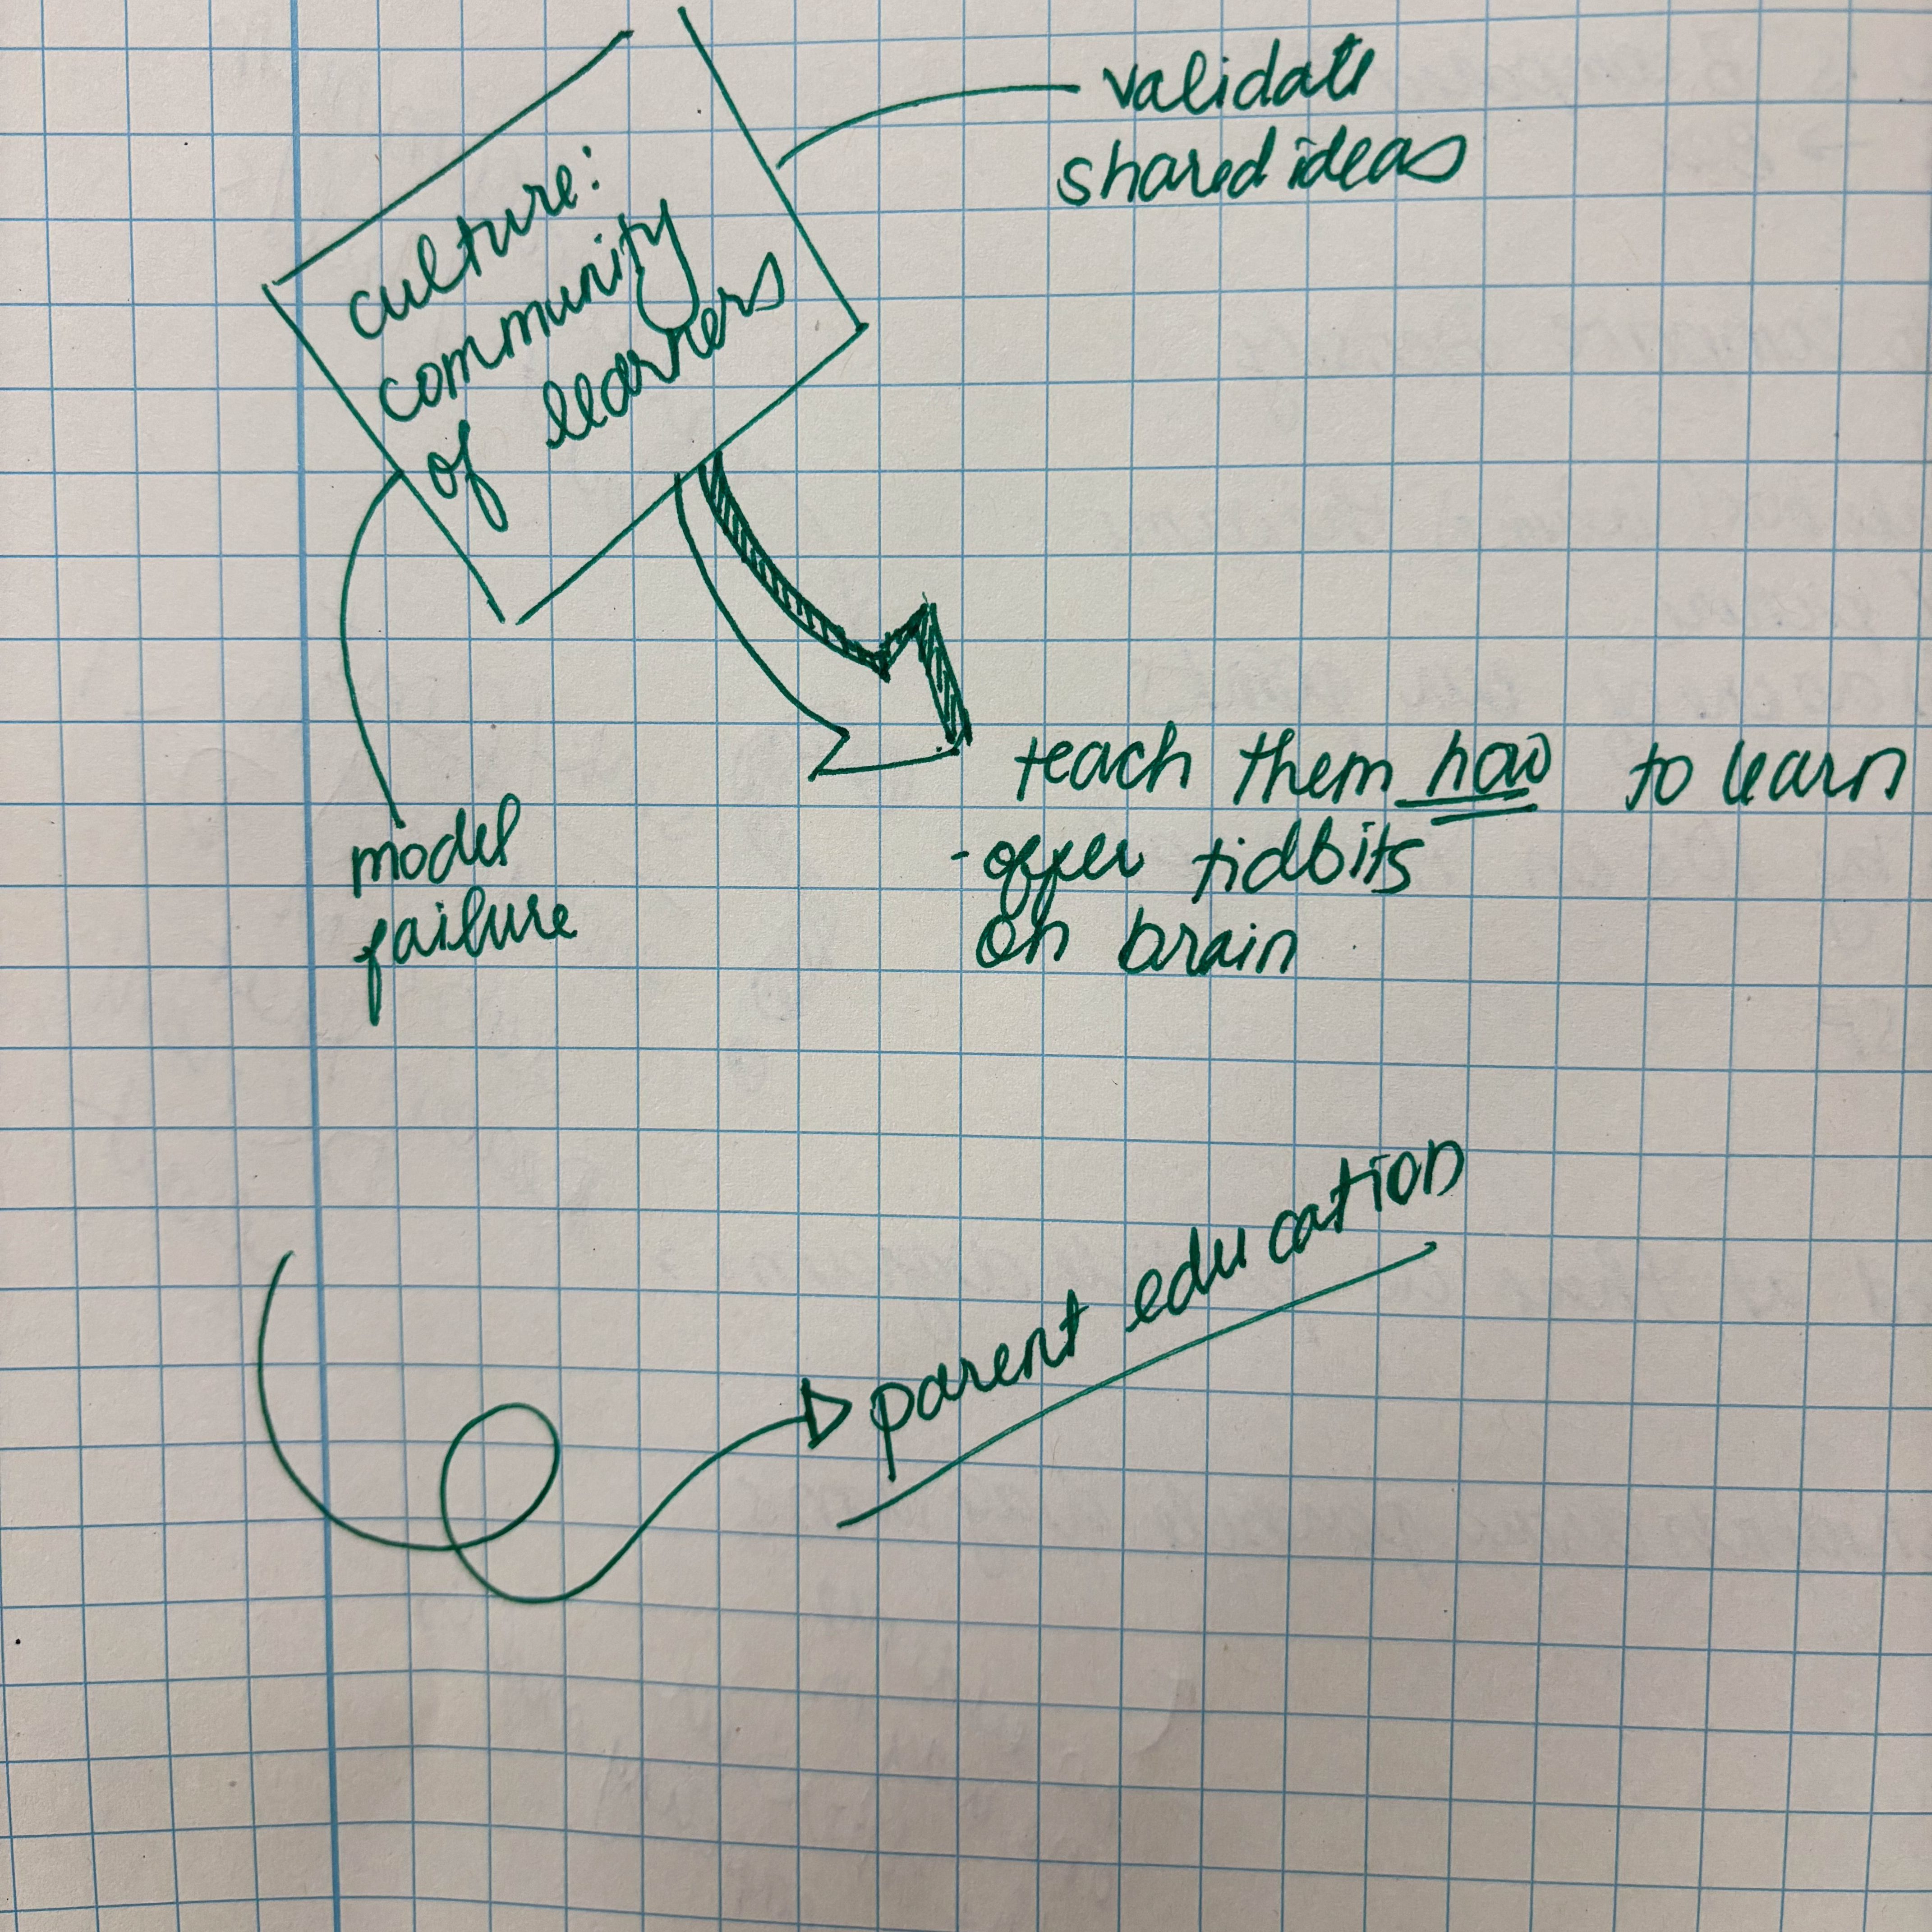
We discussed how in 1996, when this article was first presented, there was a call for more Chemistry Education Research, but here we are in 2026…saying the same thing. The conclusion I ended up writing in my notes was that students will ask themselves: How do I know this is factual? It critiques that the way traditional chemistry class is organized for students makes sense for the teacher who already has an understanding of chemistry. Rather, we should think about reorganizing the sequence of topics presented to students as it fits their learning journey. Teachers have the schema to understand that the traditional sequence of topics is logical, whereas, students do not have that operating understanding and will not be able to make sense of why things go in the order presented. Rather than having a true understanding, the students will just have to accept that the “sage on stage” is presenting facts and they’ll just retrieve it for the test.
U3 WS 1: Describing Thermal Energy Changes
We worked on completing WS 1. Some takeaways were:
Energy is a construct. It is in the sense that everyone understands it exists, but it can’t exactly be described as any one thing.
Energy can be analagous to money. Money can come in different ways: paper, plastic, coins, etc. However it looks, it can be accepted as currency if you were to try to purchase something. It is a construct in the sense that it’s made out of paper and we, as a sociey, has assigned value to this piece of paper. The example given was a $1 bill and a $5 bill. They look the same and could argue that they’re exactly the same, yet one is worth 5x the other. Energy can be stored in different ways (it can go in a checking account, savings account, and wallet).
It was here that the LOL charts were introduced. We used to have students complete them in Physics, but not completely sure when we stopped doing it that way. We do Energy Bar charts, but we don’t really look at Work. It looks like I might have to reintroduce them next year so that they’re going to be used to them when they get to Chemsitry.
U3 Lab: Energy and phase change
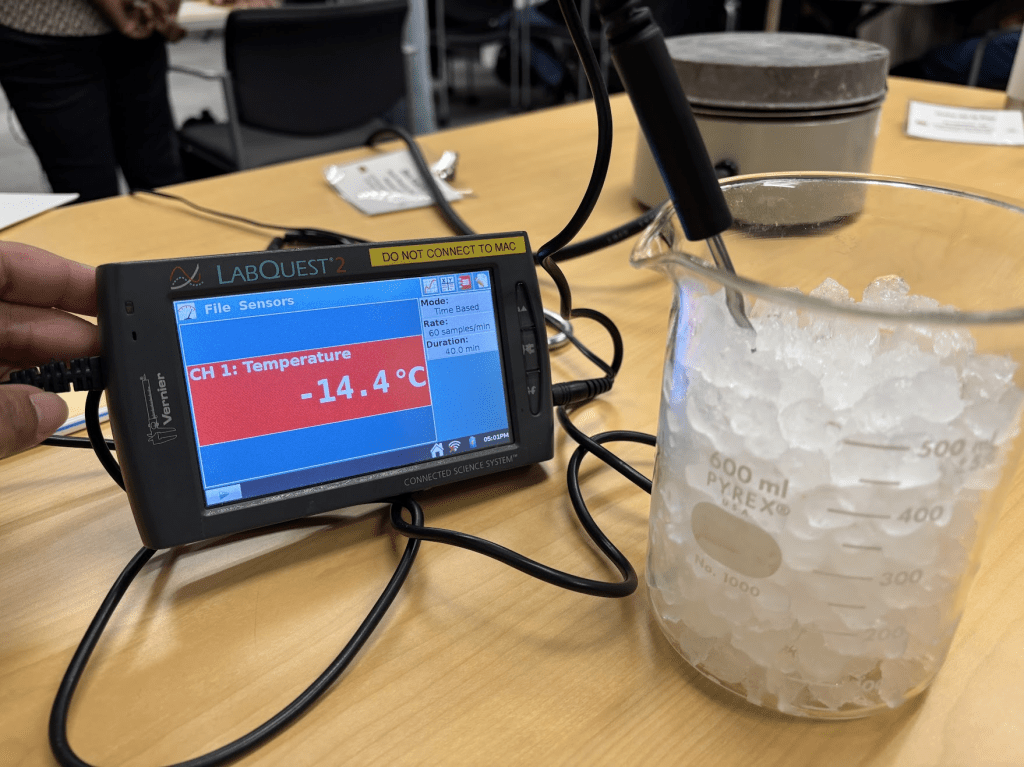
For this lab, we needed a temperature probe, LabQuest, hot plate, beaker, and the “good” ice. We were instructed to set the Data Collection to be Time Based for 40 minutes and to collect 60 samples/min. After capturing our initial temperature, we made a prediction of what our graph might look like. The graph that came out did not look like our predictions!
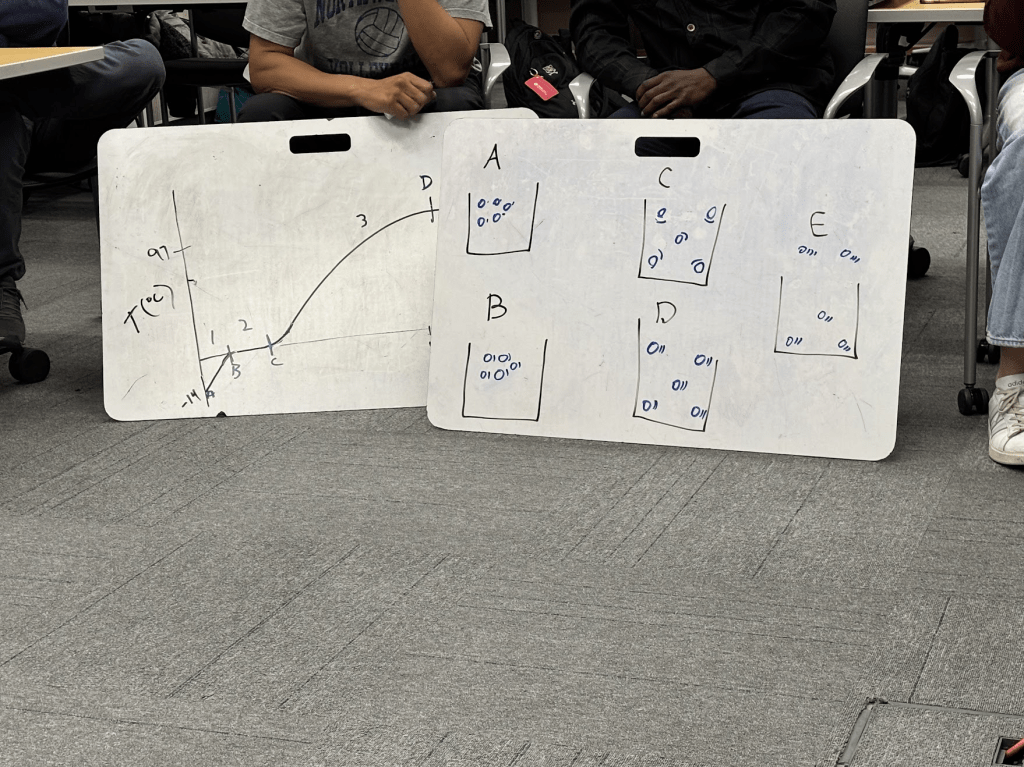
This picture shows one of the group’s results. We all whiteboarded our graphs from the data collected and what we think is happening in the particle diagrams in sections A, B, C, D, and E.
First, we were asked to look for similarities between all the boards. We were guided towards including a new convention of structure and motion of particles. We talked about how the number of whooshies can indicate which phase/state the particles might be. We also agreed that solids were much more organized than gas. One of the questions asked during the Board Meeting: “Are tehse solid or liquid? Are these particles any different?” I thought that this was a great question to ask in order to differentiate that the particles are still pretty close together. It was here where we introduced the Eph (Phase Energy).
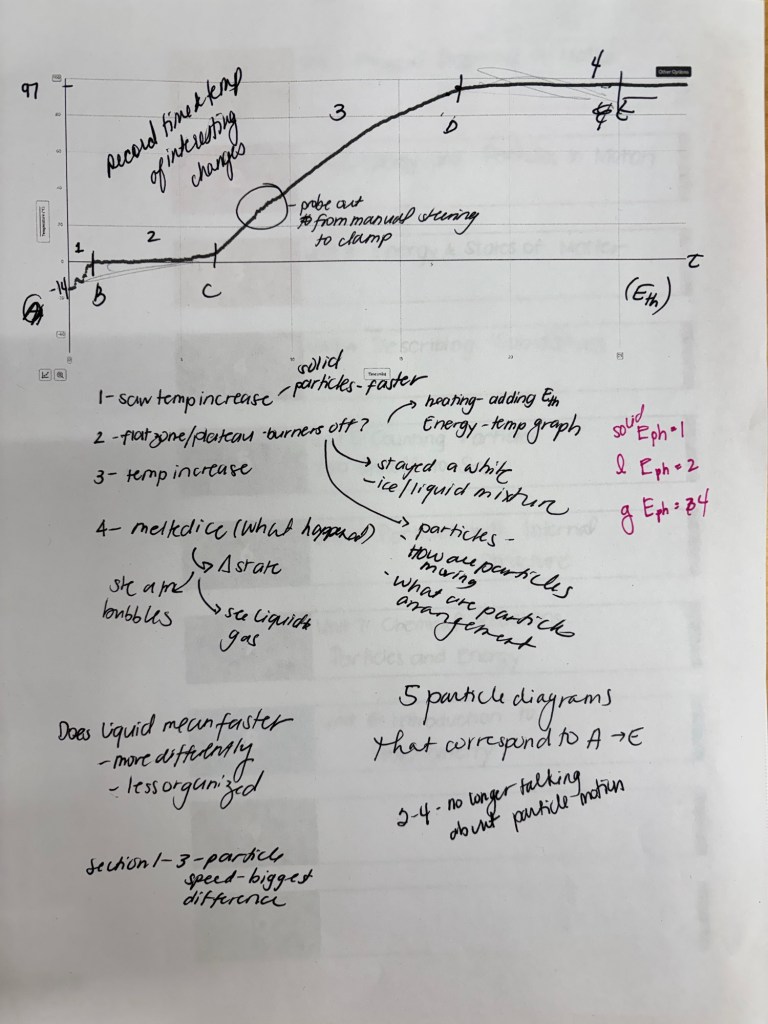
The graph our data formed plus scribble scrabble notes from the discussion.
U3 WS 2 & 3
It feels like we jumped into working out WS 2 and WS 3, but looking at my notes, there was actually some scaffolding of understanding to get us there. When we had a Board Meeting for WS 2, one of the groups took on the role as teacher. In student mode, we were asked to complete the question of drawing particle diagrams for what’s in the bubbles during boiling water. I held onto that misconception that air was inside the boiling bubbles. The group did a really great job of breaking that misconception. We determined that the things we see coming out of the beaker of water were streams of vapor. And when we hold our hand over the top, there’s a collection of water particles that will feel welt on our palm. This is evidence that it is actually H2O(g) and not air floating out of the beaker!
WS 3 proved how much I did not understand thermal energy as an undergraduate. HOWEVER, I was really good at dimensional analysis and could write the givens and cancel units out until I got the correct answer. So, it was a little frustrating that I couldn’t math my way out of truly understanding thermal energy. As I completed the worksheet, I kept thinking- man, it would be really helpful if we were forced to draw a particle diagram, include the heating curve, and/or a proportionality table.
These are the directions to the worksheet that I did NOT read. Glad to know that I was justified in my thinking of having students complete multiple representations of how they understood and solved the problems.
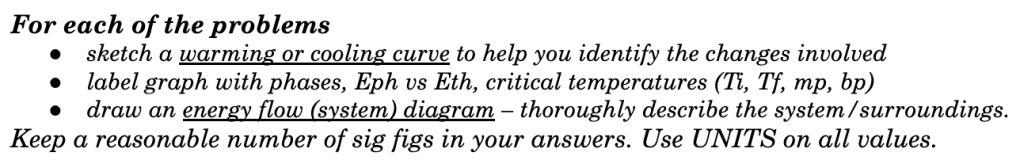
U4 Start: Demo, Video, Electrolysis
We started with a sugar cube and water was poured into it. Beaker 2 had sugar cube with isopropanol. Beaker 3 contained a sugar cube with 50/50 water/isopropanol mix. We wrote observations for all three situations, then draw particle diagrams. At this point, I already forgot the agreed upon conventions for the particle diagrams. I did not differentiate between the water and alcohol particles. I also did not draw whooshies for any of the particles. Particle arrangement was also something that needed to be paid attention to. We talked about how to maybe separate out water, sugar, and alcohol–how easy might it be to separate all three things?
Then, Mitch had a great (hopefully very practiced) demonstration of mixing salt and sand together. Then, we were asked to brainstorm some ways to separate them?
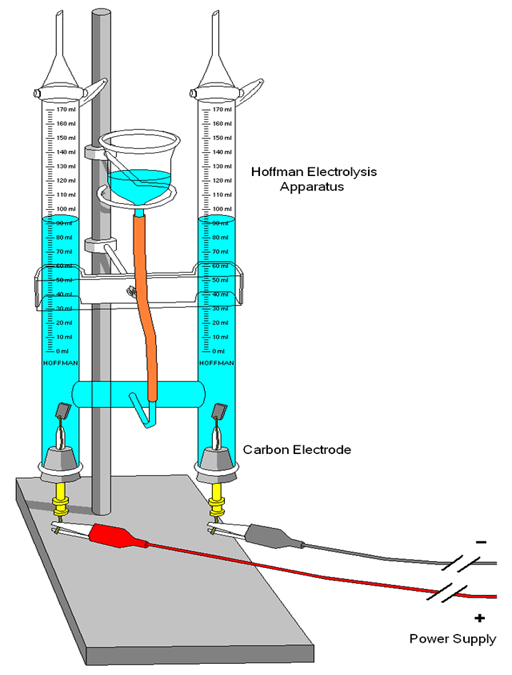
The conversation naturally then went into separating things from a compound. For example, H2O, is considered a pure substance and could it be broken down? The answer is yes, we had a demonstration using the Hoffmann apparatus. We were able to collect the H2 gas and the O2 gas, then used a match to test to see if we did collect the gases we thought we did.
We ended our day with Fe + S and what the difference is between a mixture of Fe + S and compound. I’m going to ask tomorrow what the new convention might be for something that was “created.”
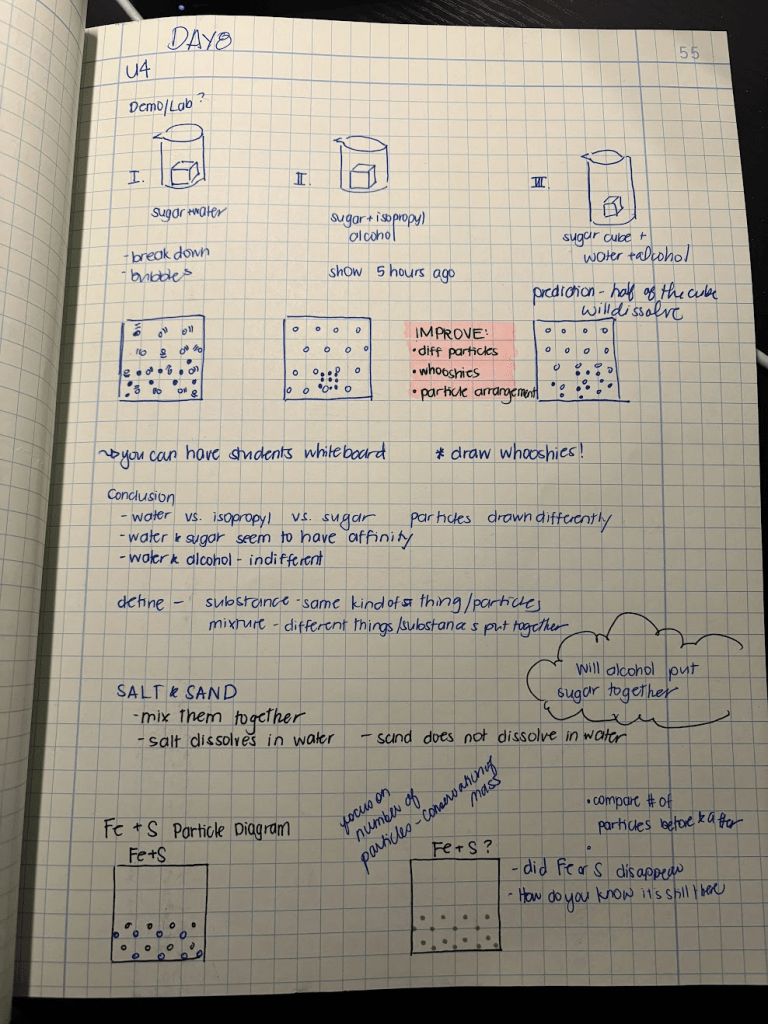
The reading discussion focused on Johnstone’s Triangle. Chemistry education rarely gives opportunity to bring all three: Macroscopic, Submicroscopic, and Symbolic together. Yet, all three are (mostly) required for students to gain a deep understanding that we’re seek.
As educators, it is easy for us to move through between the different representations of Chemistry. For example, when we say iron, are we talking about iron in our lab, the atom, or the symbol Fe. Our students will have a harder time identifying which representation of iron to use as they are novice chemists. When I started at SHC, we were administering the FCI as a pre-post-test for 9th grade Physics. I had no idea there was a Chemistry version of that, which was referred to as the ABCC. We took a version of it at the beginning of this workshop, and I thought it was a fantastic way to measure their growth of learning. The conversation then went towards cell phone use at school and responsible use of technology. I did write flipping Physics in my notes, so I’ll have to explore that a bit to find out why I wrote it.
How does a straw work?
Today, I learned that I didn’t understand how a specific technology item worked. That item would be a straw. I figured you stuck the straw in liquid, sucked it in, and then delicious cold beverage. In class, I learned that it’s far more complicated and underappreciated. It’s an elegant way of looking at how air particles and water particles might interact with this piece of technology. I never looked at a straw as a study of particle motion, and here we were. I’m not sure exactly where it would fit, though I did look at the teacher’s notes. I’m not sure if students at this point would know the IFE-PVTn table or if this would come before then. If before the 3-part PVT lab, then I figure there might be more focus on the air particle motion rather than the water. Otherwise, I think students might make the mistake of thinking that water particles behave in the same way as air.
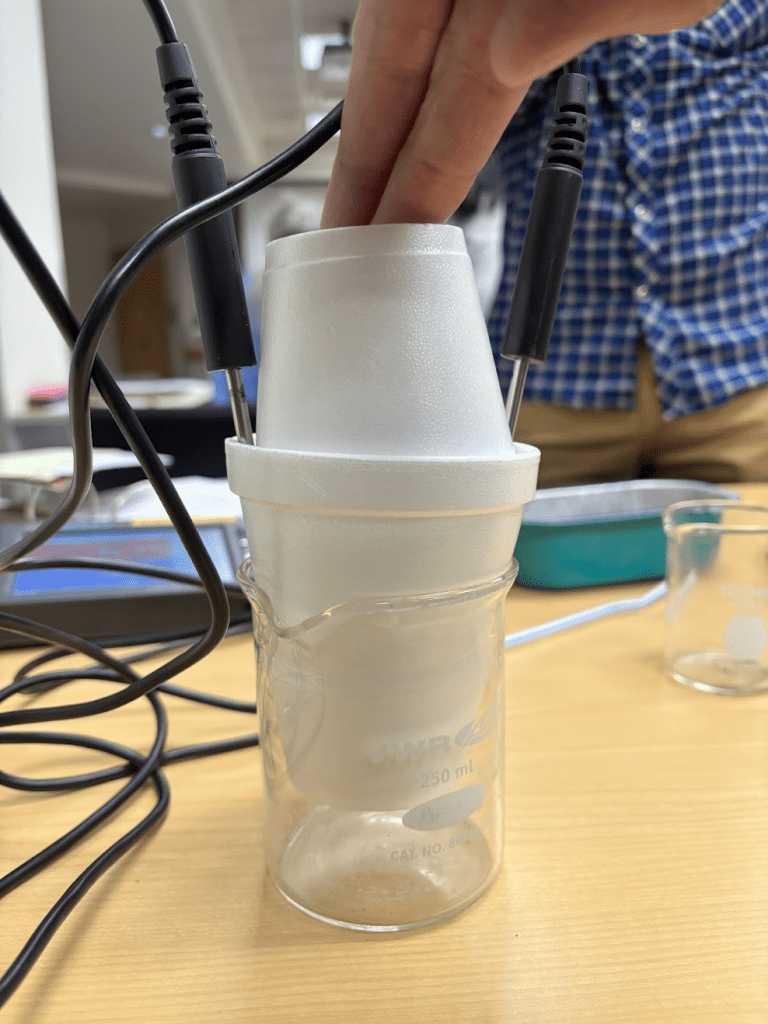
U3 Lab: Thermal Energy & Temperature
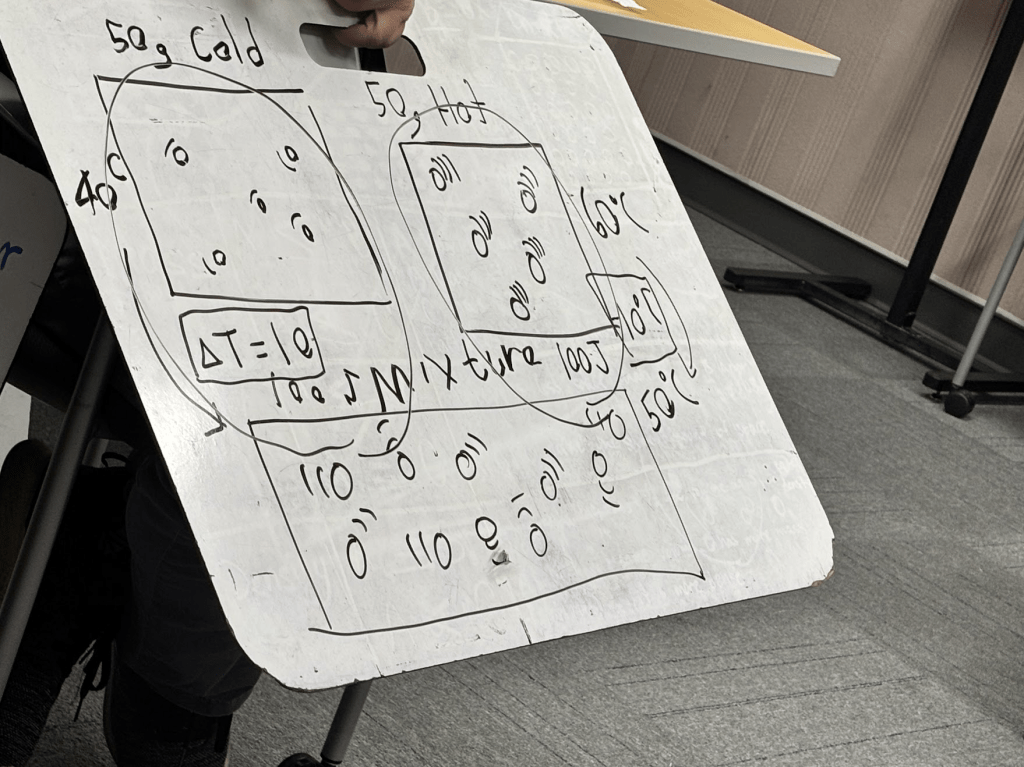
For the Eth & Temperature lab, we had a calorimeter, temperature probes, and varying things to measure. First time around was 50 g Warm Temp/50 g Room Temp water. Second, we used 50 g Warm Temp/100 g Room Temp water. Third time around we used 50 g Warm Temp/50 g Copper shots. We took the initial temp of each separately. Then we made a prediction of what the final temperature might be. Then poured and quickly started collecting the temperature of the combined mixture.
We put up each group’s data on a whiteboard. And instead of each group making a whiteboard, we created a collective one. We discussed each situation and then drew particle diagrams for each. This image is for Part 1 of the lab, and as a class, we decided it to be true that the Hot temp “gave a whooshie” to the cold temp in order for all the particles to be at the same temperature.
It was at this point that I ended up lost. Hopefully, we revisit this in Day 7 and maybe iron out some wrinkles in our understanding of heat capacity.
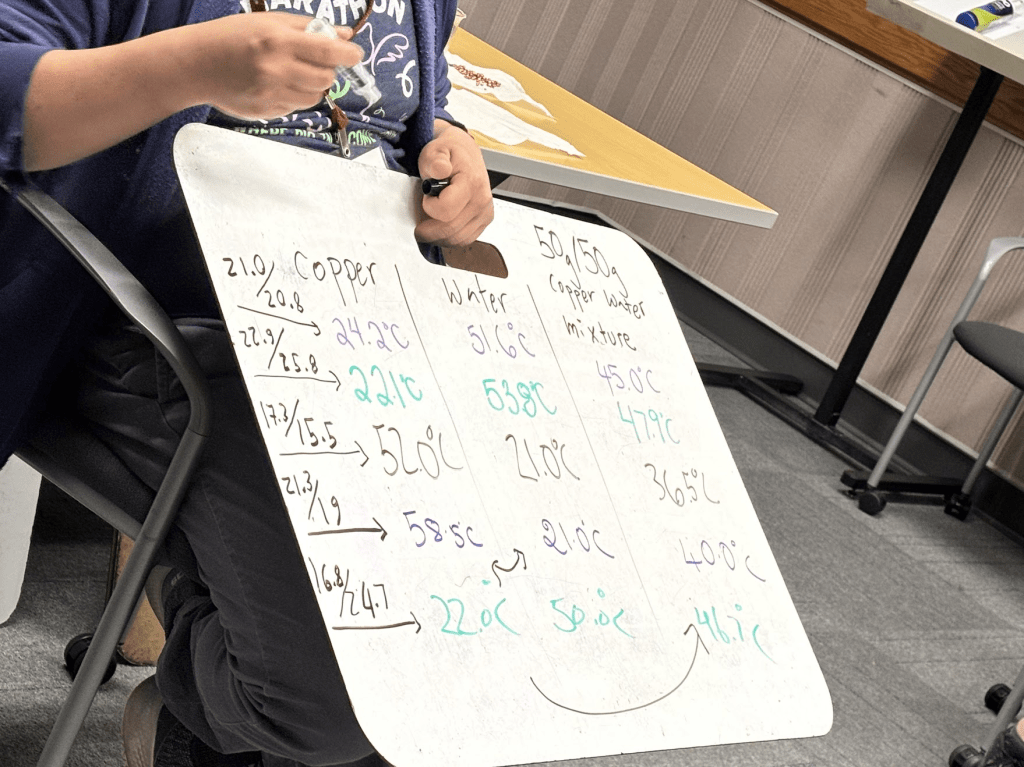
On the left most part of this data table, we calculated the change of temperature for copper and change of temperature for water. We saw that some groups had a greater temperature change for copper and some had a greater temperature change for water. What accounts for the differences we see? Which one heats up faster or slower? We determined that the copper material heated up faster, and that different materials havea. different rate of energy transfer. But how we got from the question to the conclusion…the map got lost somewhere along the way. This was how heat capacity was introduced. I thought I understood heat capacity, but it seems that I might have it backwards.
We ended our day with working on Unit 3 Worksheet 1. We worked on some heat transfer questions. Our lab group kept trying to use the heat transfer equation, Q = m · C · ΔT, but we had to be reminded that the students don’t know that. We had a quick discussion of whether or not we would introduce to our students. I probably won’t because I don’t want students memorizing equations. I want them to understand concepts.
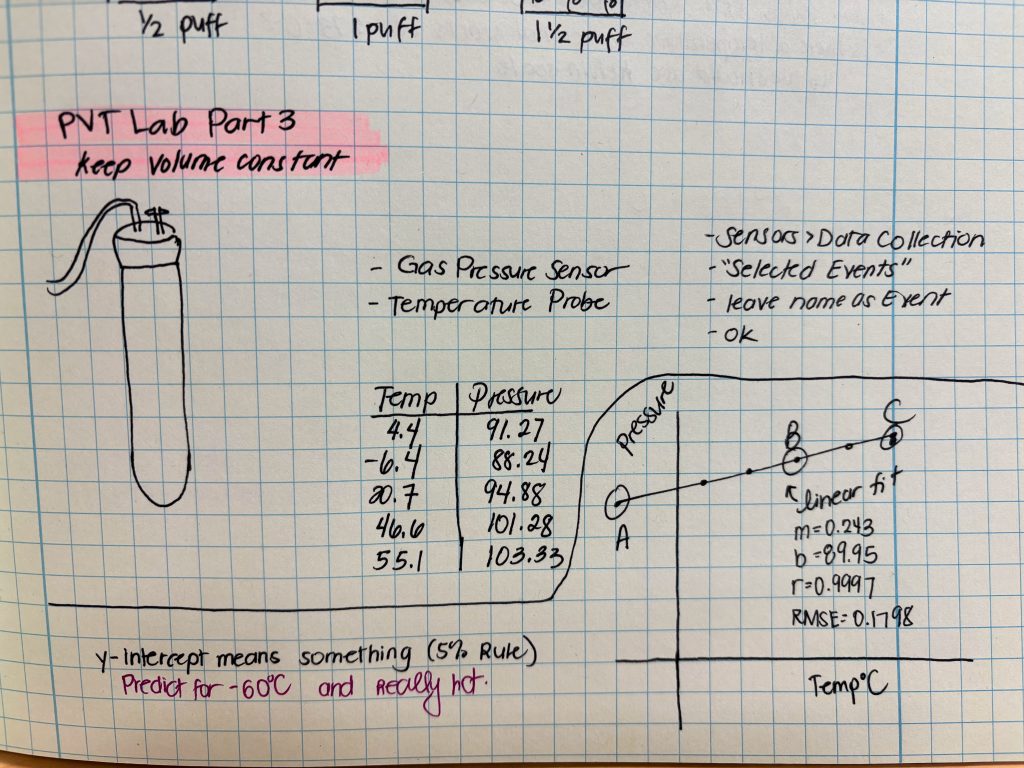
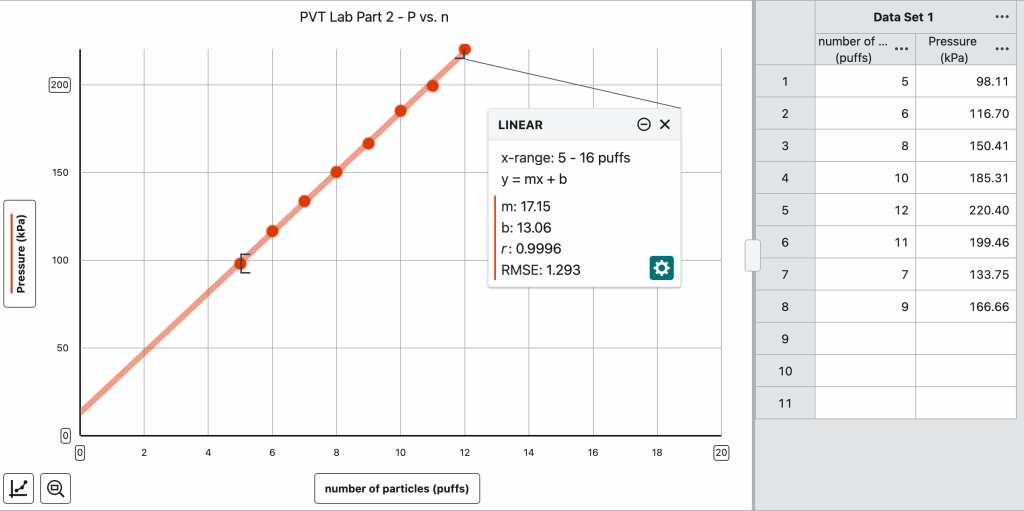
Data Collection: There were 5 stations that each had a liquid in a container of varying temperatures. There was super hot all the way to super cold. We used the Vernier Gas Pressure Sensor and the Vernier Temperature Probe to collect the Pressure and Temperature data. Our data formed a linear like graph.
Our data collection of Part 3. We graphed it and made a linear fit.
We graphed it and then discussed what the y-intecept meant. We continued the discussion to get us to discuss what the x-intercept might be given our data. It was revealed that the x-intercept was the absolute zero if we’re using the Kelvin scale to get a direct relationship. The next conversation was about the relationships between each variable.
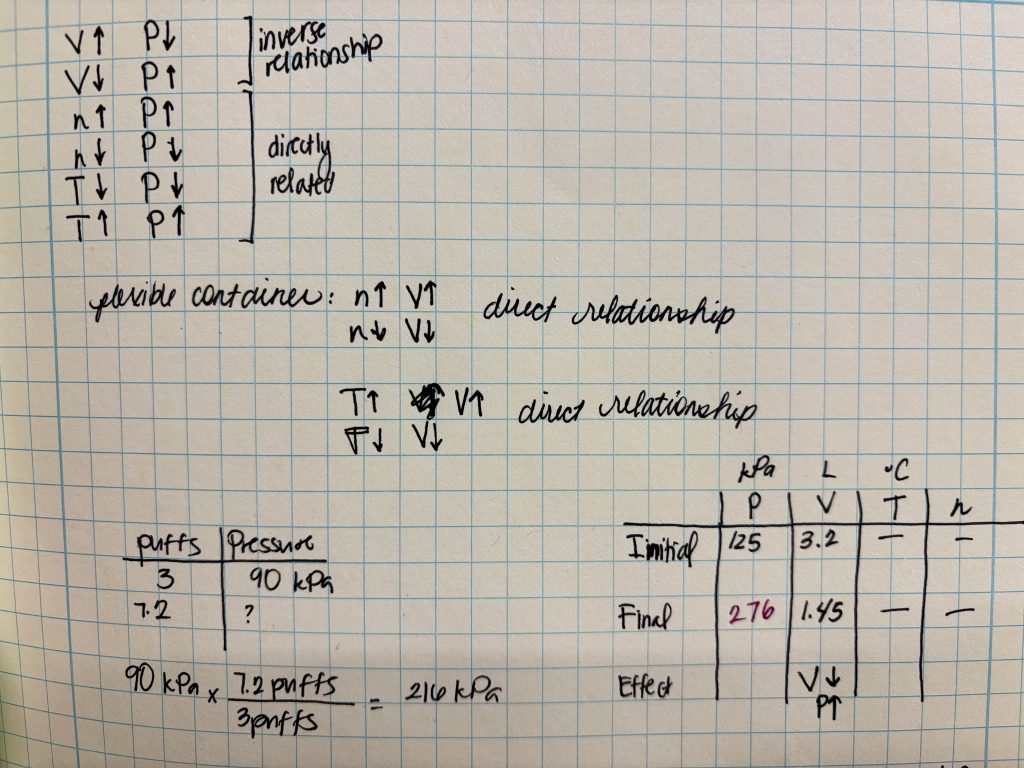
We talked about which variables had an inverse relationship and which ones had a direct relationship. From there we transferred our knowledge into table form. Then worked on Worksheet 3: PVTn Problems using the table format. I think I’m going to need to do more practice with using this way to solve problems. I also liked that it was pretty easy to see which numbers would go up and down. At this point, we don’t have the equation yet. Peeking ahead, I’m not sure we will?
Some takeaways from the group discussion of the article:
Ideally, whiteboarding groups should be in groups of 3. I was creating too big of groups for Chemistry. For Physics, I was creating groups of 3. I need to maybe get more materials so that I can accommodate groups of 3 for whiteboarding.
It seemed to be a general consensus that we ALL need more practice in Socratic dialogue. I for one would love to read more of a how to, or some sentence starters. I used to have a notebook or document or something where I would write down really great questions to ask students each unit. I have since then lost that artifact.
Not all students plan to be a chemist or major in chemistry. Our role is to teach critical thinking through the context of Chemistry.
U2 – Energy and Particles in Motion
New unit lab/demo. To open up the unit, we watched Mitch light a match, blow it out, and waited. Whenever the smell got to us, we raised our hands to show that we smelled the sulfur, and we kept our hands up. I thought I’d smell it first since we were so close to Mitch, but it looks like the back of the room were able to smell the burnt match first.
We discussed the demo of two different temperatures of water. The hot water had red food coloring and the cold water had blue food coloring. We discussed with our partners what we thought was happening. Then we had to go back and redraw our model that include particles and the conventions we had agreed to use. We talked about the particles were in motion, and so we needed to add whooshies. The hot water beaker should have particles with more whooshies than the cold water. It was important that the water particles and dye particles were both drawn. The convention was that the number of whooshies would also indicate a difference in temperature between the particles.
U2 WS1 – Particle Motion
The apparatus that showed a thermometer using water and isopropyl alcohol as the liquids.
It was not until our Board Meeting did I realize that I keep missing the point: particles. I did not draw any particles on our board. Rather, I focused on the process that Celsius used in creating the thermometer. The discussion kept going back to the particles. What are the particles doing as heat is applied?What are the particles doing when cooled down? The idea of Eth was also introduced. In student mode, I kind of see the writing on the wall. Am I going to be learning the equation to calculate Eth? We learned that heat (Eth) involves temperature AND mass.
Eureka Videos
We watched a series of videos about molecules in different states and the motion of particles. This is where it becomes reiterated that heat makes the particles move faster, making the movement less predictable. The evaporation and condensation of liquids has something to do with the particles colliding with each other, walls of test tube, etc. I’m thinking maybe these videos can be homework or look for the corresponding text in the book.
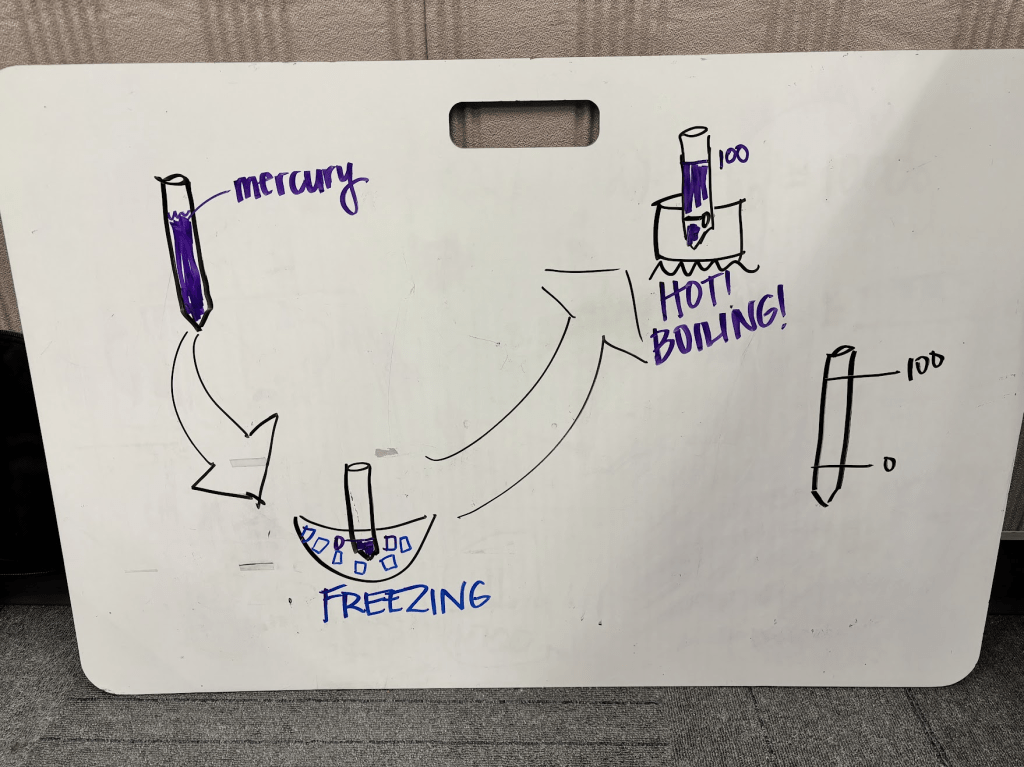
One of the takeaways was how to make a thermometer. I learned how Anders Celsius created the scale of O – 100. What I missed was the drawing of the particles expanding and condensing and that’s essentially the value of the thermometer. It’s able to quantify the hotness of something.
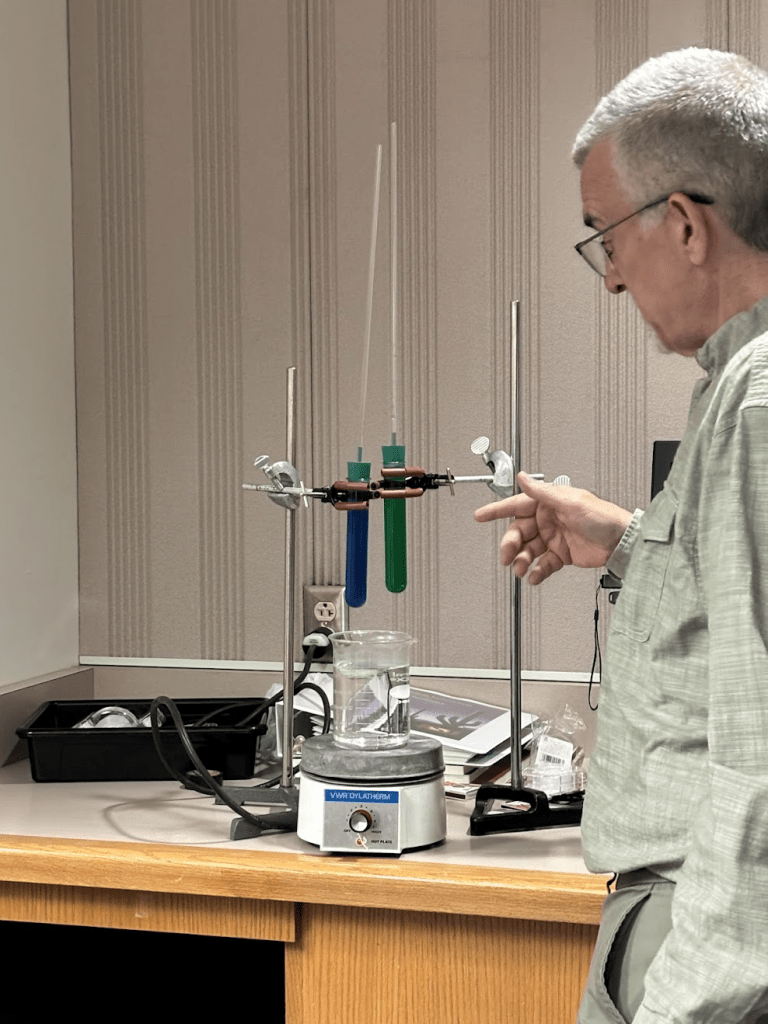
Lab: Volume-Pressure
In this lab, we connected a 20 cc syringe to a Vernier Gas Pressure Sensor.
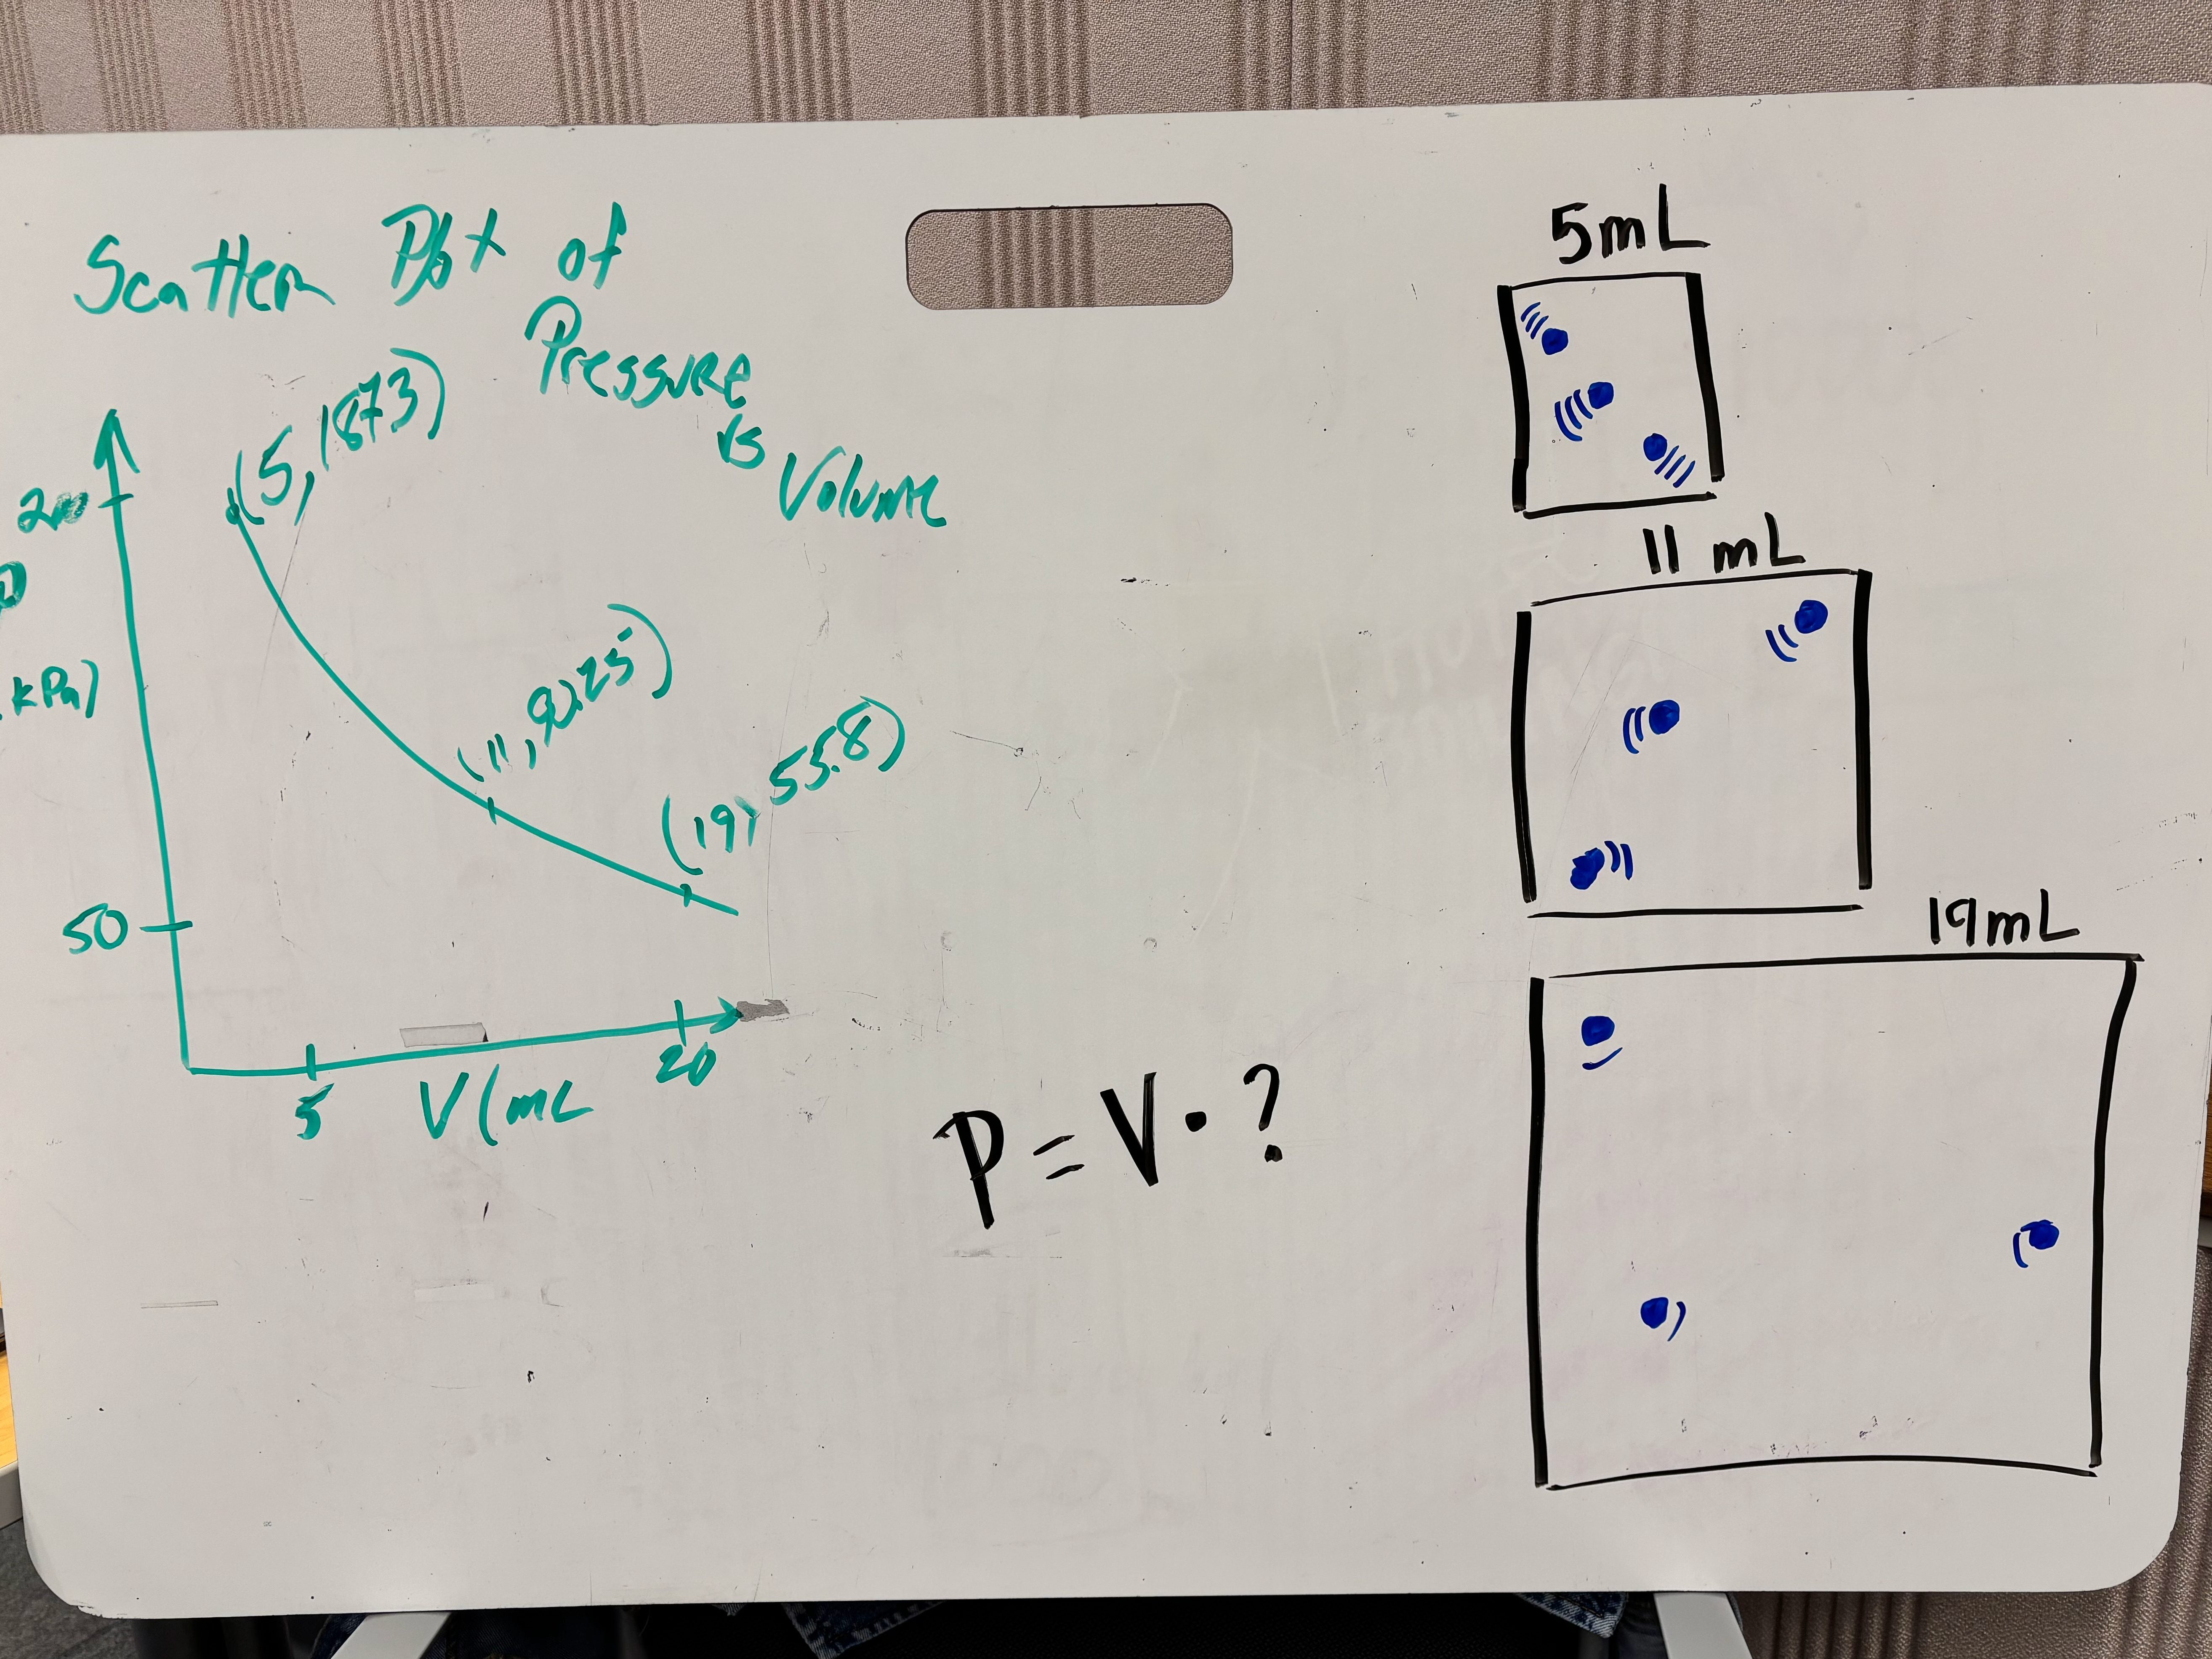
Our original whiteboard. I drew our particles to have decreasing whooshies as our Volume got larger. We anticipated that this might be a student misconception that the particles move faster when the Volume is decreased. Our Board Discussion consensus was that the whooshies on the particles would represent the temperature of the particles (move faster). The particles itself would be moving at the same speed, but would have further to travel.
We collected data using the Gas Pressure Sensor from Vernier. Hooked up the machine to the LabQuest screen thing. Each data point was collected by getting the average over 10 seconds. We used a syringe connected to the Gas Pressure Sensor to manipulate the Volume. I like the proportional thinking that would go into this. As Volume doubled, Pressure ________.
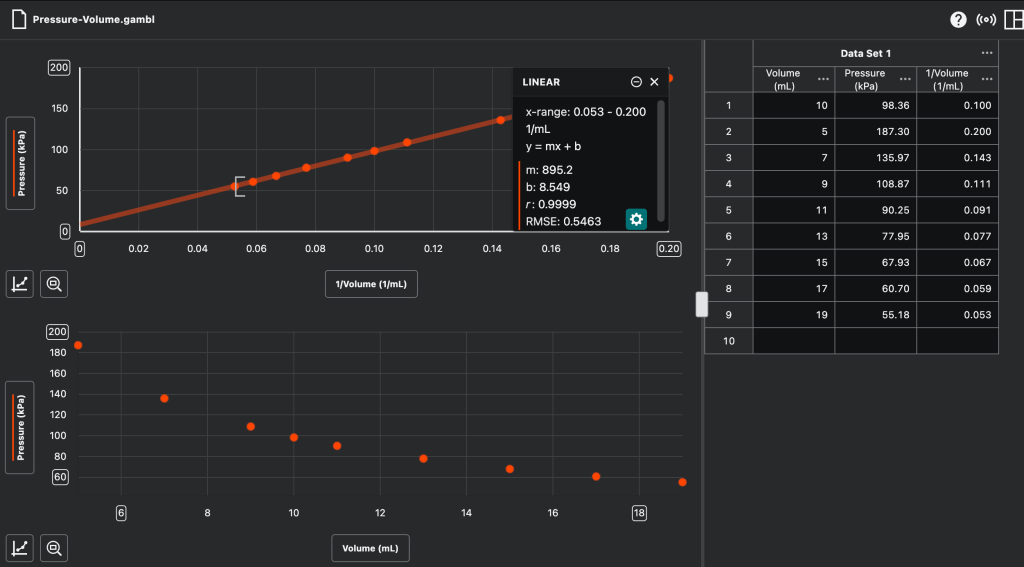
We took our data from the sensor and put it into Graphical Analysis. Our first iteration of the Pressure-Volume graph got us a curve line. The 9th grade Physics students would say it’s an exponential line (because it’s curved). I’m not completely sold on the linearization (top graph) of the data so that we would get that P = 1/V.
I pretty much spent today writing down the questions both Mitch and Jae asked us while we were preparing our whiteboards. I aslo appreciated having Rich as a lab partner. I’m going to be so sad when we get split up next week to new seats. Even though I have been modeling with Physics for some time, I still struggle because I haven’t seen or thought about Chemistry content since 2004. That was the year I last took any Chemistry class, which was Organic Chemistry…in college.
This was my notes that resulted from the discussion. There was so much more that I missed because I couldn’t write/process fast enough!
Lab: Gases
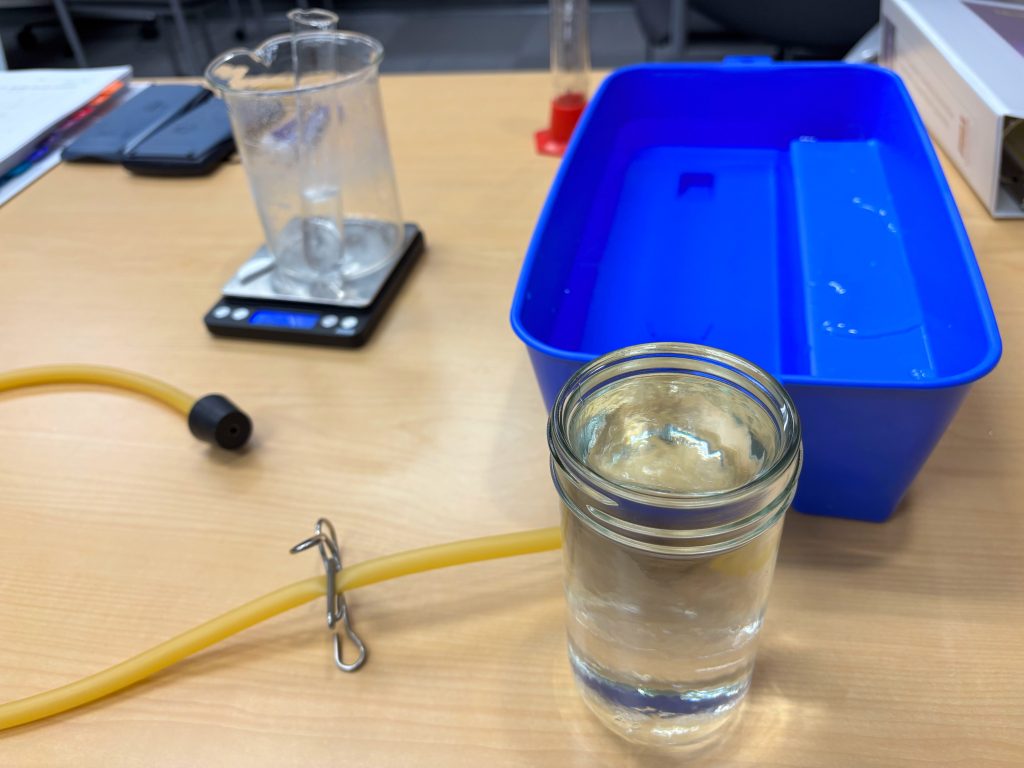
There wasn’t much given in terms of how to do the lab. There was no write-up of the procedures to follow. Because it was one of the first tasks of the day and I’m not taking 5 other classes, I was able to follow. I wonder if I should give students a general thing that’s written down, project the setup on the screen, walk through the setup, and then allow them to figure it out. Luckily, my partner was able to remember what we were supposed to do.
He had the beaker, test tube, and alka-seltzer on the scale. I just needed to fill ⅓ of the test tube up with water. So this would be the massbefore. To complete our apparatus, we needed the jar filled with water and the trough to be halfway full. It was very important that we clip the hose connected to the hole so that we wouldn’t spend our lab time cleaning up water.
We covered the jar with a plexiglass square. Then flipped it over and put it into the trough over the hole. I slid the plexiglass square out from under the jar. I was not completely successful in making sure that all the water stayed in the jar and we ended up with a small air bubble at the top. Mitch assured us that it was negligible, but also to include that information if our data came up horrible. Rich was in charge of quickly covering up the test tube. I had the job of dropping the alka-seltzer into the test tube and then removing the clip so that the air could travel through the hose.
We collected the massafter by allowing the reaction to complete before removing the stopper and reading what it said on the scale. I feel that it was smart that we kept the beaker/test tube thing on the scale so that it could remind us to read the massafter. We collected the volume of CO2 by measuring the amount of water before and after the reaction. Our final density value was pretty close to the accepted value of CO2 gas. We started to discuss if dry ice which is CO2 (s) would have the same density as CO2 (g). Even though they’re made up of the same particles, would they have the same density? We were asked to draw a particle diagram of CO2(g) and CO2(s). If the substance changes states, would it still be the same particle? There was some discussion about making it an opportunity to use proportional reasoning for this moment. Otherwise, I might get students to draw 21 particles in 1 mL square and 1500 particles in 1 mL squares (like I did). The result was: when vaporizing something, it’s a space issue and not a separate substance issue.
Lab: How thick is this aluminum foil?
This was such an elegant way of going from macroscpic measurements to scientific notation because of how small an object is. It was an easy way to introduce scientific notation and how to remain consistent with SFs. I really liked that students had to find their own way to figure out the thickness of the aluminum foil. We decided that we could measure the length and width of foil, and then use the Volume formula to find out the thickness of foil. From the data collected, we discovered that foil had 2 different thickness. Actually, we were given two different kinds of foils. What might explain the difference? Could individual atoms be that large?
U1 WS5 – Relationships Between Units
Working on WS5, I couldn’t help but do the problem using dimensional analysis. I’m in love with the DA train I learned in high school. When I started using the tables to show my work, it reminded me of how we used to do x-t tables and students need to show the Δx and Δt and from there, they get their slope. It bothered us so much that there were no tables to show our work that I just went ahead and revised WS 5 to include tables.
During the WB discussion, there was looking at the change across the equal sign (different units) instead of vertical (same units). I kind of like across the equal sign because it establishes the ratio, but I like the vertical–because of the mantra: What you do to one side, you do to the other.


You must be logged in to post a comment.