
Day 7: Flipbooks

Today, we finally go the chance to introduce the Physicists of 406. I normally like to do this on Day 2 or Day 3, with Day 1 being a 45-minute period. I had no idea that missing that normal Day 1 would throw me off my timing so bad. Regardless, students filled out some information about themselves. I believe I got the idea from Jill Westerlund when she had done the AP Computer Science Principles Summer Institute. I used to do a different one, but students wouldn’t know what to put in because it was too much freedom. But maybe I’ve gone overboard with these ones.
After completing our introductions, we looked at the skate park. Instead of giving them the link, I had them google “energy skate park pHet.” Students clicked on the first result. To my surprise, the skate park has changed. I should have included the word “basic” in their search to be able to get the old one we used. The original skate park had a skater whose pronouns we did not assume. The new version has a variety of skaters that included a dog. Of course we chose the dog as our example because who can resist the hilarity of a dog skating endlessly on a frictionless ramp?


Their jamboards turned out okay. We talked about each box being a “state,” and how each “frame” needed to be different from each other. There was some struggle with the idea that the time difference between each frame needed to be the same. Some of the discussions got stuck with the idea of the distance covered by the skater stayed the same. We were able to debunk that idea by using the “Speed” option and showcasing the speedometer. Students made the argument that they couldn’t have possibly covered the same distance if they were having different speeds. [That was an interesting statement, but I had to gloss over it for the next unit].
Day 8: Practicing System Schema and State Diagrams
Mrs. F and Mr. R (our new colleague) came up with a template that helps students organize their thoughts about what to include in their state diagrams. In the previous classes, we talked about how conditions make up a state, and what those conditions are. It boiled down to conditions are position, shape, and motion. At some point in my planning, I found an old slide from last year where I drew triangles in between states to show the change. Students identified or listed those changes.
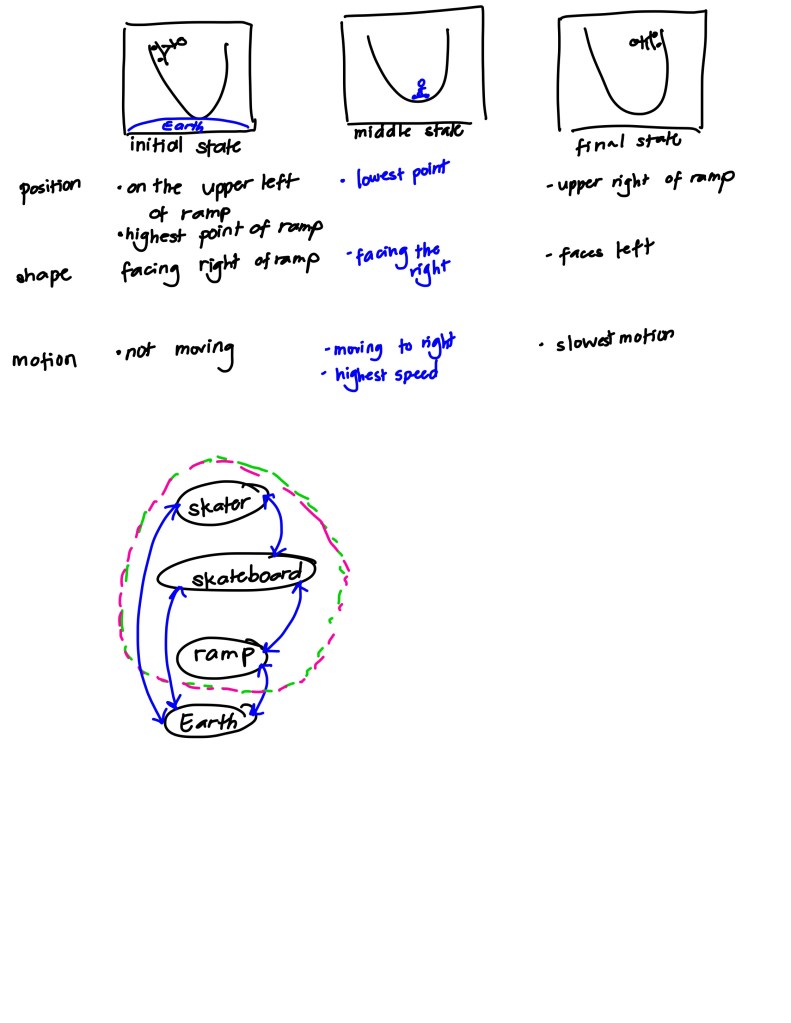

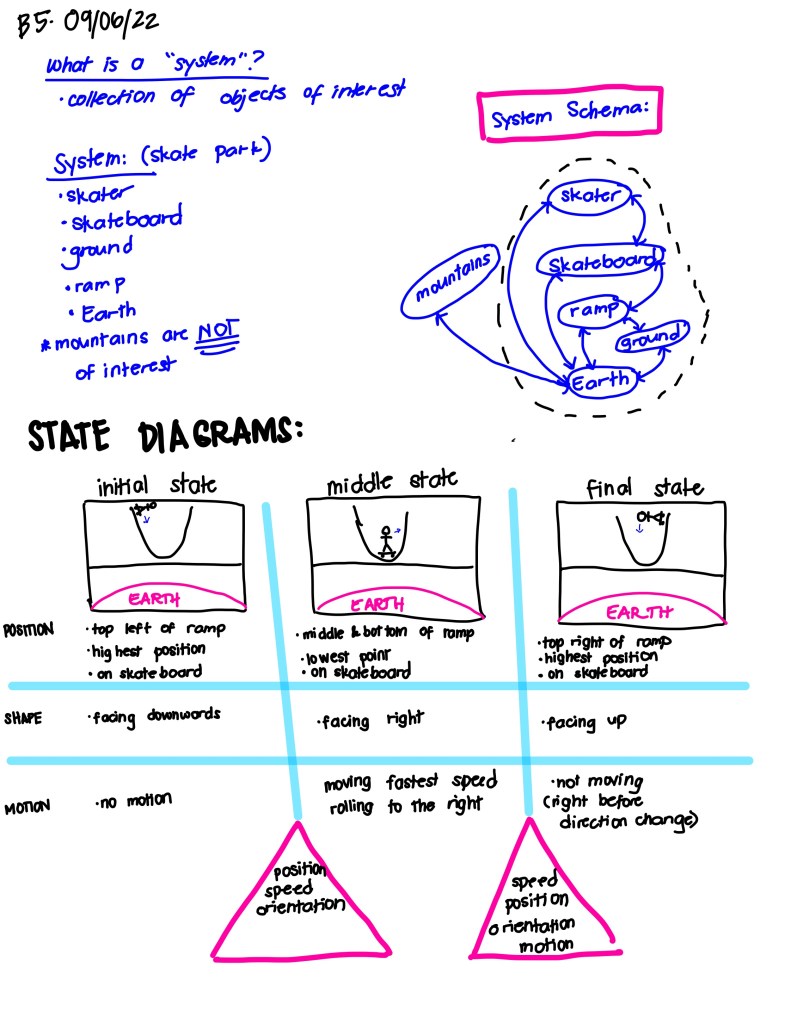

I think that this template worked pretty well. It helped students determine what conditions were changing from state to state. I’m hoping that this is a scaffold we can take away soon enough so that students don’t get stuck on the technicalities of scaffolding.
There were a couple of blocks that got stuck on adding extraneous items into the system. At one point, we had listed the skaters clothing items individually. When they found out that they would have to address each of those items in the drawings, we went back to the stick figures. Then we discussed the importance of the mountains in the background. Thankfully, we came to a consensus that the mountains were not relevant to the system and didn’t add to the changes.
Homework is to finish all 6 stations in drawing a system schema and state diagrams. Historically, students have not done this homework for various reasons. I would be delighted if students came to class and actually had this assignment done.
