
PVT Lab Part 3: Pressure-Temperature
Data Collection: There were 5 stations that each had a liquid in a container of varying temperatures. There was super hot all the way to super cold. We used the Vernier Gas Pressure Sensor and the Vernier Temperature Probe to collect the Pressure and Temperature data. Our data formed a linear like graph.
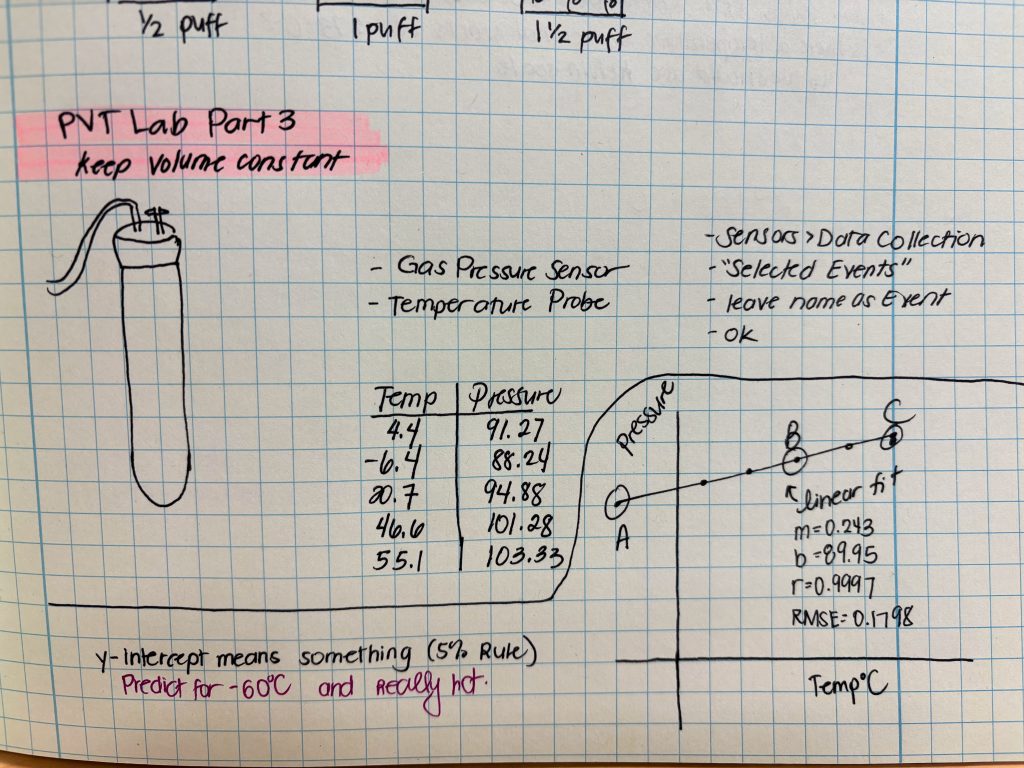
We graphed it and then discussed what the y-intecept meant. We continued the discussion to get us to discuss what the x-intercept might be given our data. It was revealed that the x-intercept was the absolute zero if we’re using the Kelvin scale to get a direct relationship. The next conversation was about the relationships between each variable.
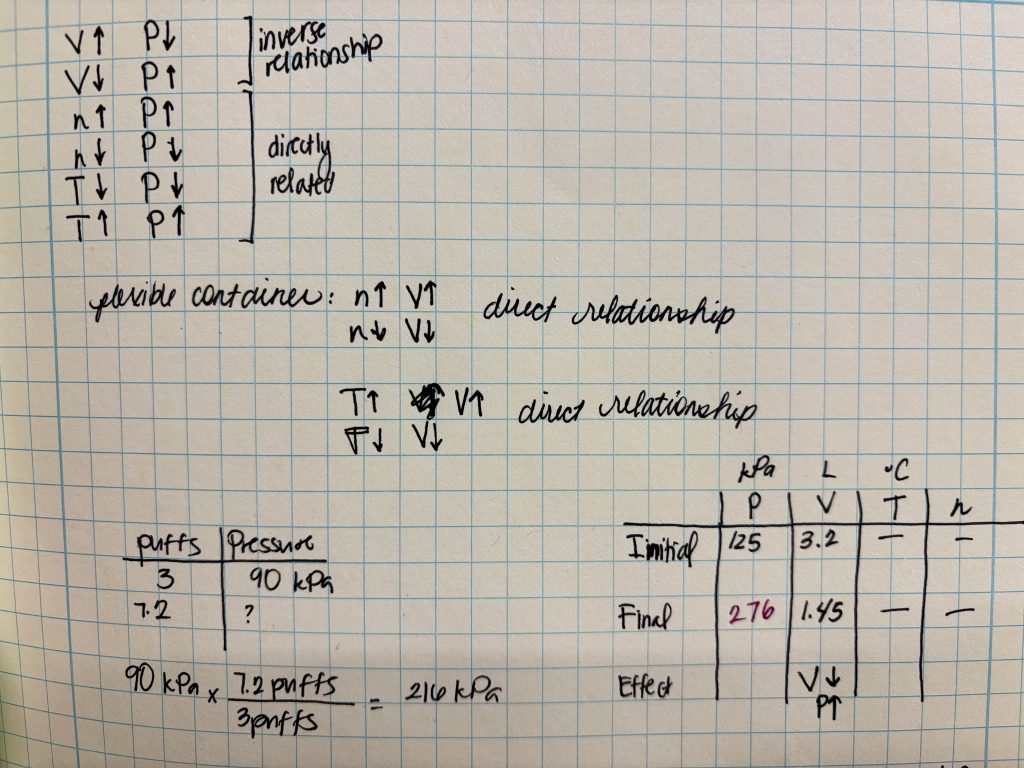
We talked about which variables had an inverse relationship and which ones had a direct relationship. From there we transferred our knowledge into table form. Then worked on Worksheet 3: PVTn Problems using the table format. I think I’m going to need to do more practice with using this way to solve problems. I also liked that it was pretty easy to see which numbers would go up and down. At this point, we don’t have the equation yet. Peeking ahead, I’m not sure we will?
