
Wenning Article Discussion
Some takeaways from the group discussion of the article:
- Ideally, whiteboarding groups should be in groups of 3. I was creating too big of groups for Chemistry. For Physics, I was creating groups of 3. I need to maybe get more materials so that I can accommodate groups of 3 for whiteboarding.
- It seemed to be a general consensus that we ALL need more practice in Socratic dialogue. I for one would love to read more of a how to, or some sentence starters. I used to have a notebook or document or something where I would write down really great questions to ask students each unit. I have since then lost that artifact.
- Not all students plan to be a chemist or major in chemistry. Our role is to teach critical thinking through the context of Chemistry.
U2 – Energy and Particles in Motion
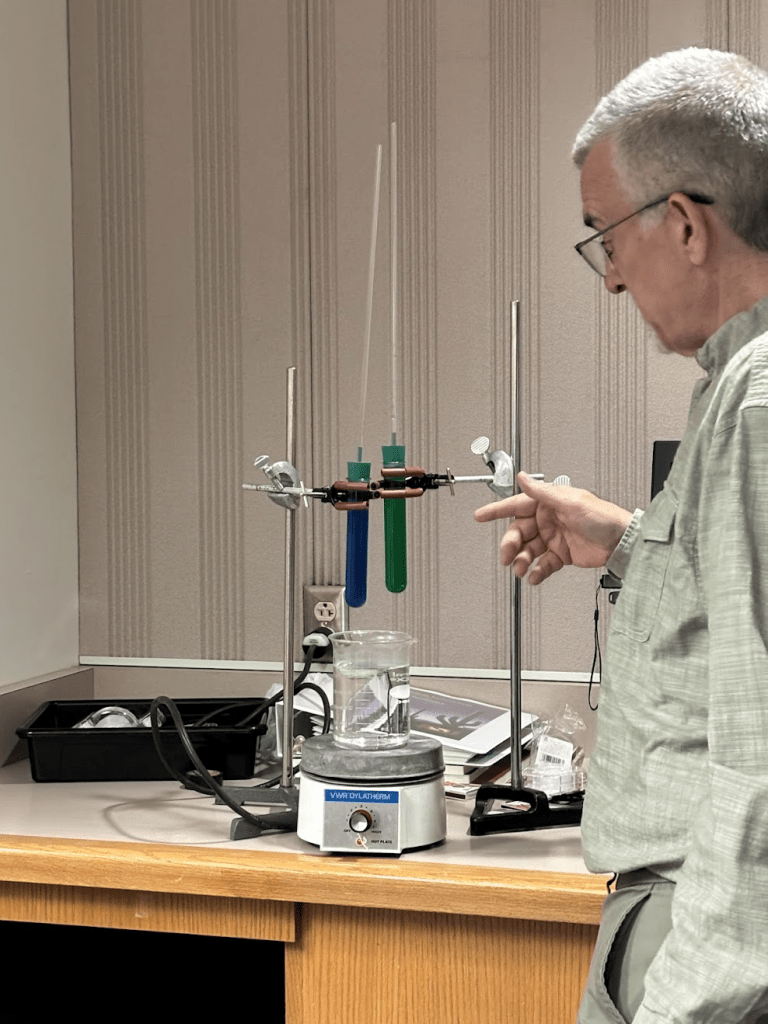
New unit lab/demo. To open up the unit, we watched Mitch light a match, blow it out, and waited. Whenever the smell got to us, we raised our hands to show that we smelled the sulfur, and we kept our hands up. I thought I’d smell it first since we were so close to Mitch, but it looks like the back of the room were able to smell the burnt match first.
We discussed the demo of two different temperatures of water. The hot water had red food coloring and the cold water had blue food coloring. We discussed with our partners what we thought was happening. Then we had to go back and redraw our model that include particles and the conventions we had agreed to use. We talked about the particles were in motion, and so we needed to add whooshies. The hot water beaker should have particles with more whooshies than the cold water. It was important that the water particles and dye particles were both drawn. The convention was that the number of whooshies would also indicate a difference in temperature between the particles.
U2 WS1 – Particle Motion
It was not until our Board Meeting did I realize that I keep missing the point: particles. I did not draw any particles on our board. Rather, I focused on the process that Celsius used in creating the thermometer. The discussion kept going back to the particles. What are the particles doing as heat is applied? What are the particles doing when cooled down? The idea of Eth was also introduced. In student mode, I kind of see the writing on the wall. Am I going to be learning the equation to calculate Eth? We learned that heat (Eth) involves temperature AND mass.
Eureka Videos
We watched a series of videos about molecules in different states and the motion of particles. This is where it becomes reiterated that heat makes the particles move faster, making the movement less predictable. The evaporation and condensation of liquids has something to do with the particles colliding with each other, walls of test tube, etc. I’m thinking maybe these videos can be homework or look for the corresponding text in the book.
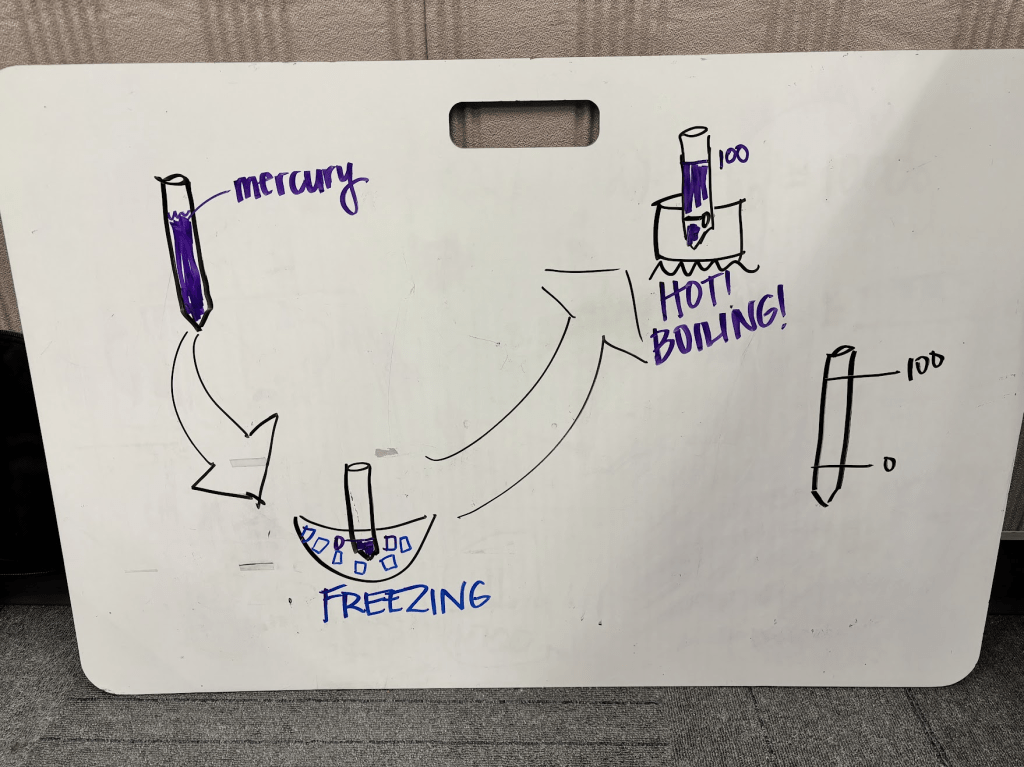
One of the takeaways was how to make a thermometer. I learned how Anders Celsius created the scale of O – 100. What I missed was the drawing of the particles expanding and condensing and that’s essentially the value of the thermometer. It’s able to quantify the hotness of something.
Lab: Volume-Pressure
In this lab, we connected a 20 cc syringe to a Vernier Gas Pressure Sensor.
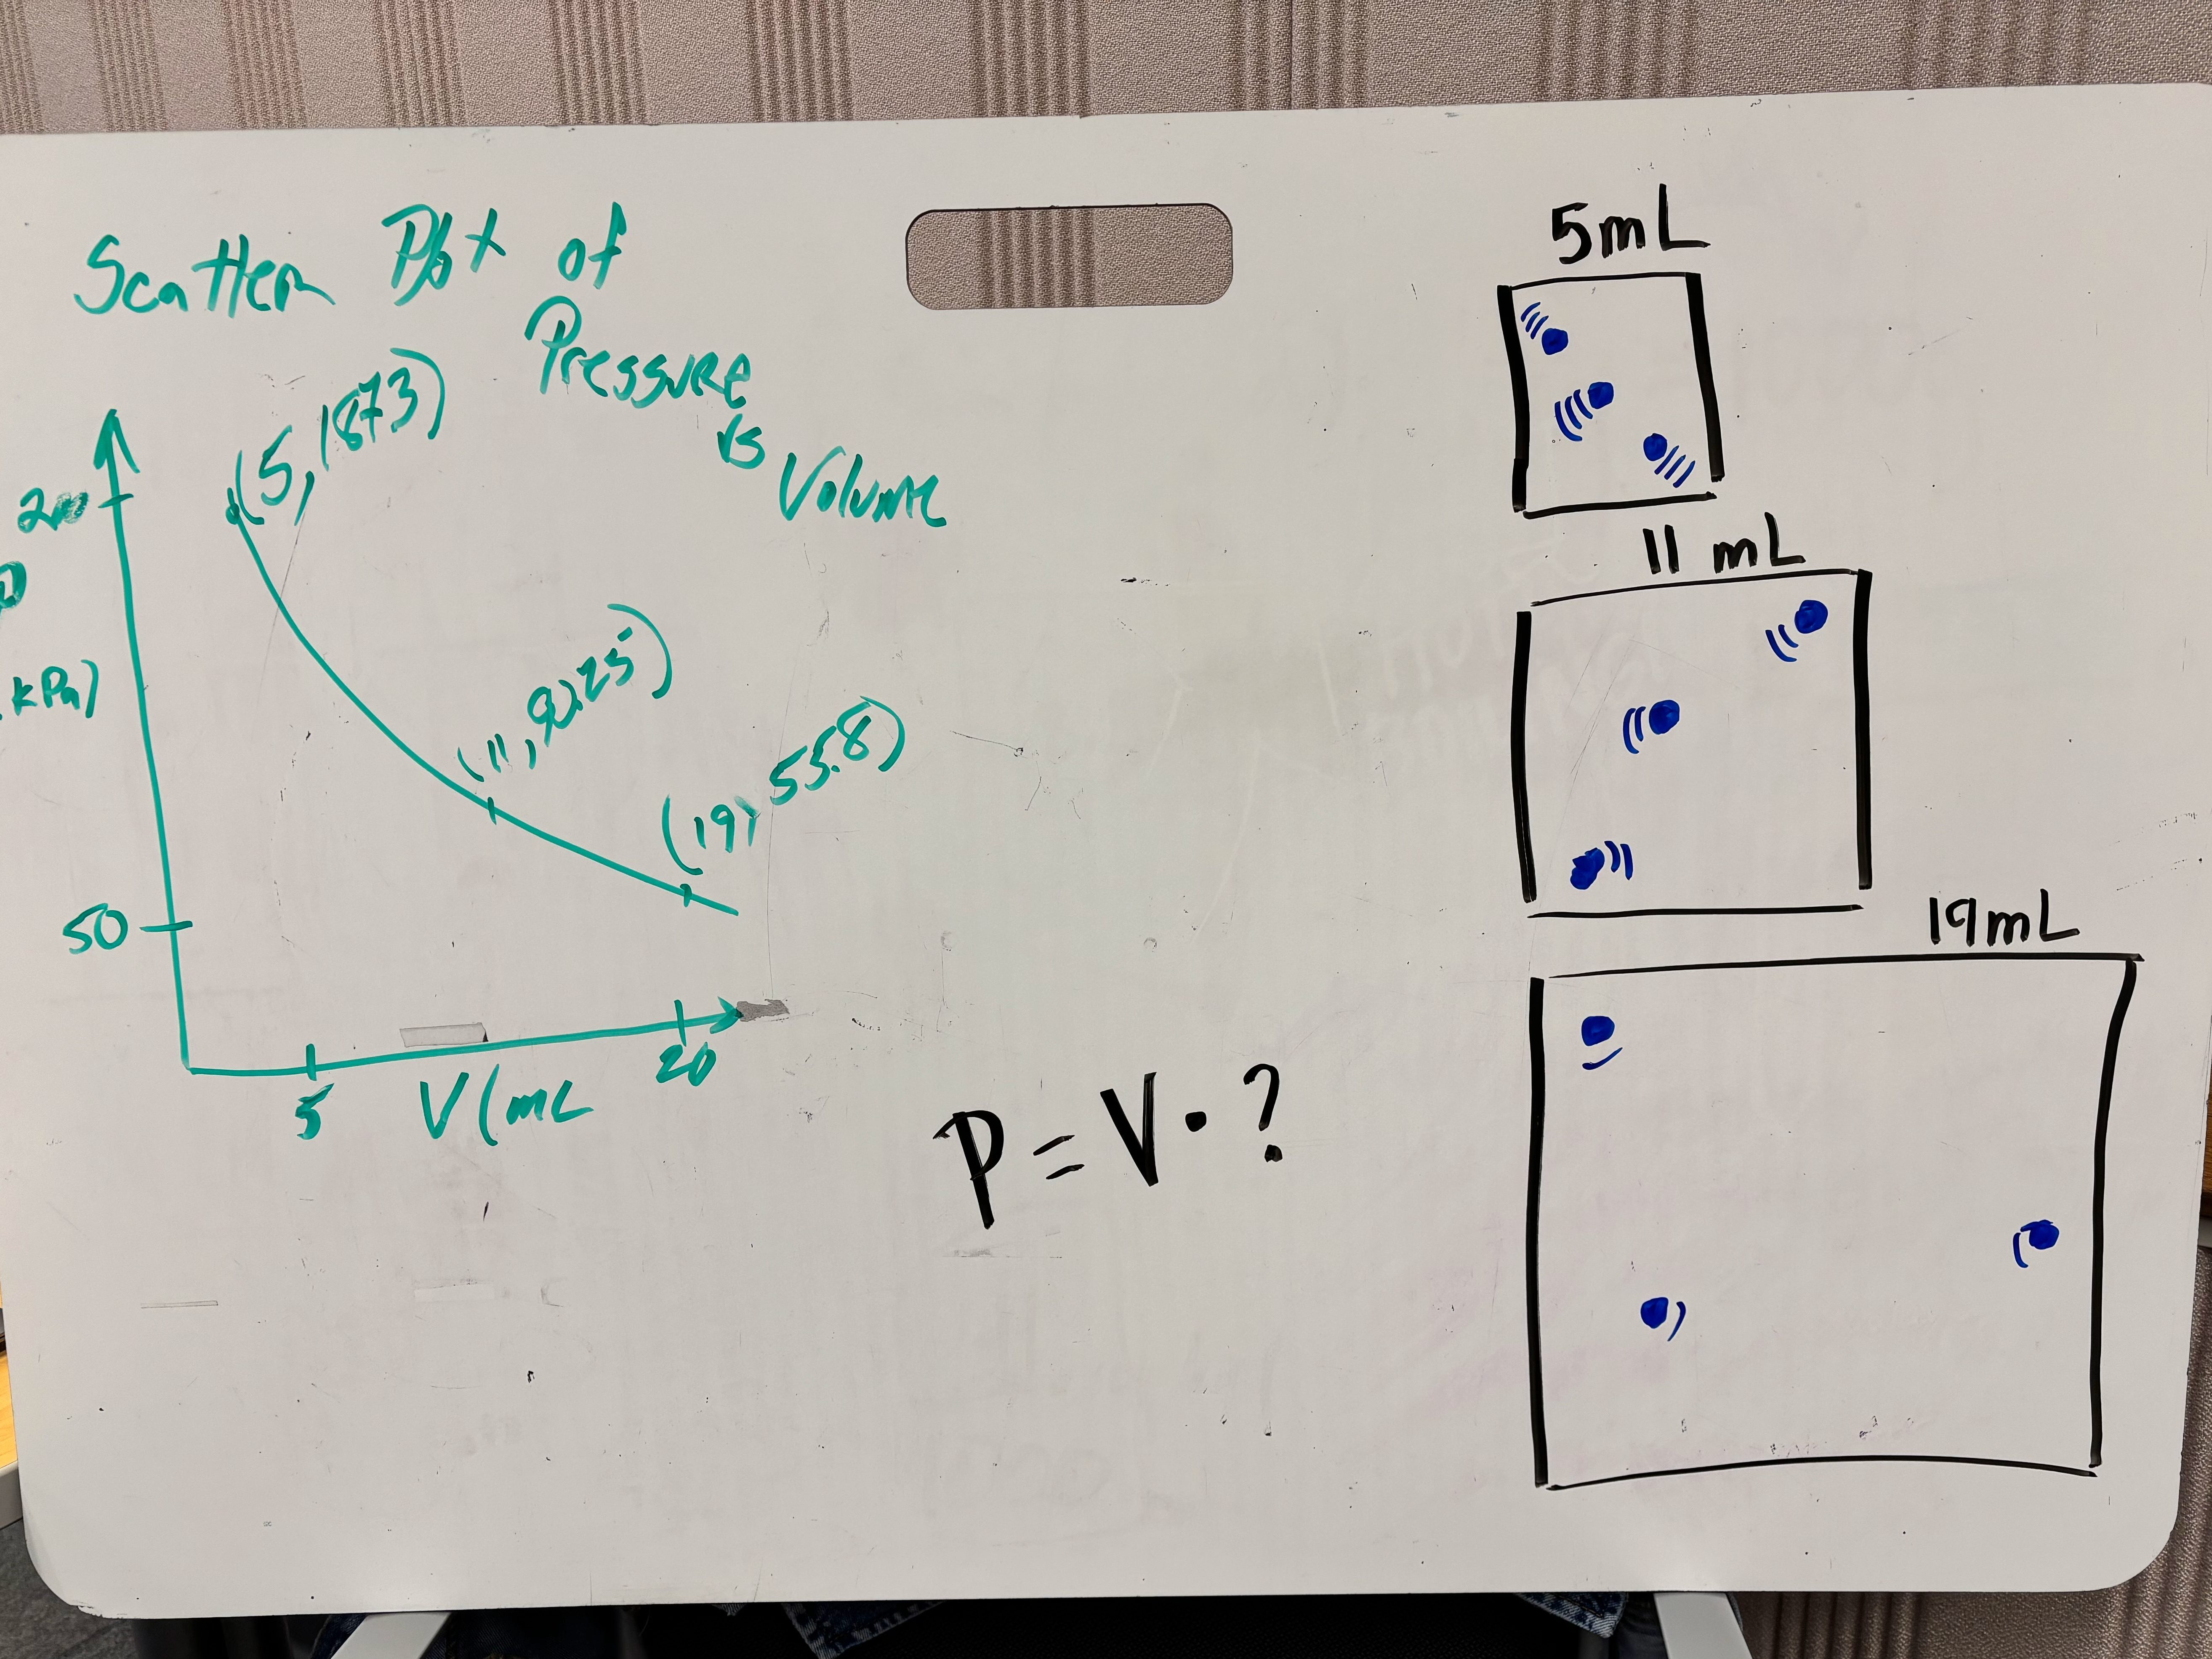
Our original whiteboard. I drew our particles to have decreasing whooshies as our Volume got larger. We anticipated that this might be a student misconception that the particles move faster when the Volume is decreased. Our Board Discussion consensus was that the whooshies on the particles would represent the temperature of the particles (move faster). The particles itself would be moving at the same speed, but would have further to travel.
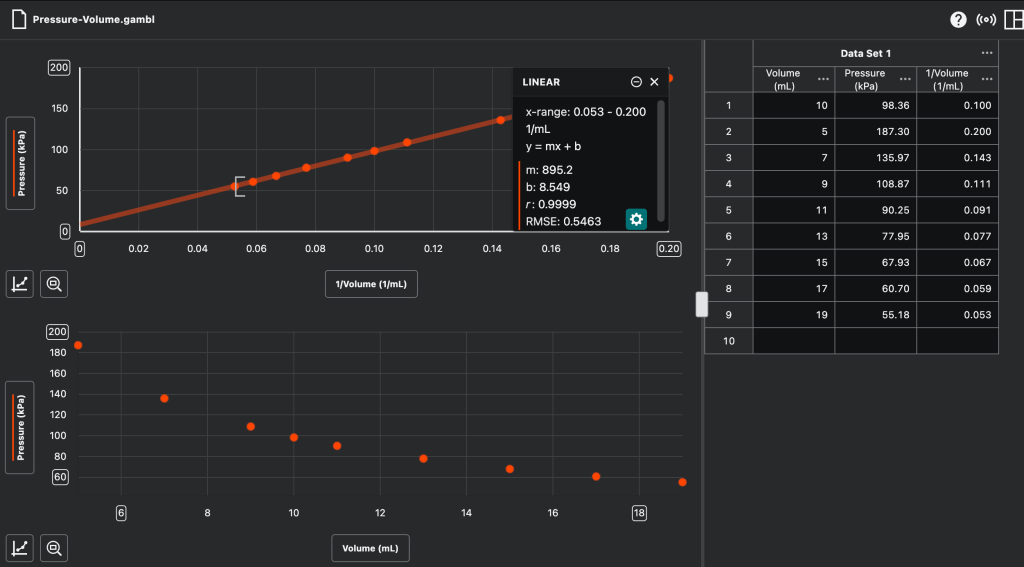
We took our data from the sensor and put it into Graphical Analysis. Our first iteration of the Pressure-Volume graph got us a curve line. The 9th grade Physics students would say it’s an exponential line (because it’s curved). I’m not completely sold on the linearization (top graph) of the data so that we would get that P = 1/V.
I pretty much spent today writing down the questions both Mitch and Jae asked us while we were preparing our whiteboards. I aslo appreciated having Rich as a lab partner. I’m going to be so sad when we get split up next week to new seats. Even though I have been modeling with Physics for some time, I still struggle because I haven’t seen or thought about Chemistry content since 2004. That was the year I last took any Chemistry class, which was Organic Chemistry…in college.
