June 29-Jul 2, 2020 @Molloy College with Jill Westerlund
pre-COVID: I took a one-day AP workshop in January with Jill to help me teach AP Computer Science Principles more effectively. It’s my first year teaching, and I mostly went along with the flow of relying on CodeHS as the vehicle to deliver the instruction.
I was wrong to do this. While CodeHS is an excellent tool to help teach the content, I should have crafted something much more meaningful. I’m pretty sure my one section of students were aware to the fact that it wasn’t really such a great experience on their end (and on mine). I did the homework assigned along with the students, and it really was a lot. The short video clips, while informative, did not help further the understanding into a deeper, more intuitive level.
[June 29-Jul 2, 2020]
During #MERIT18, we all experienced the drinking from the firehose moment of just having so much given to us. These four days were definitely THAT. On top of that, I signed up thinking 8:30am-4:30pm wasn’t such a bad schedule to do Monday-Friday. I thought, that it could probably be helpful in getting ready for the school year. Folks, here’s where I tell students the importance of reading AND comprehending: 8:30am-4:30pm EST. I’m over here living my life in Pacific Time, and it didn’t occur to me that I would be doing this 5:30am-1:30pm.
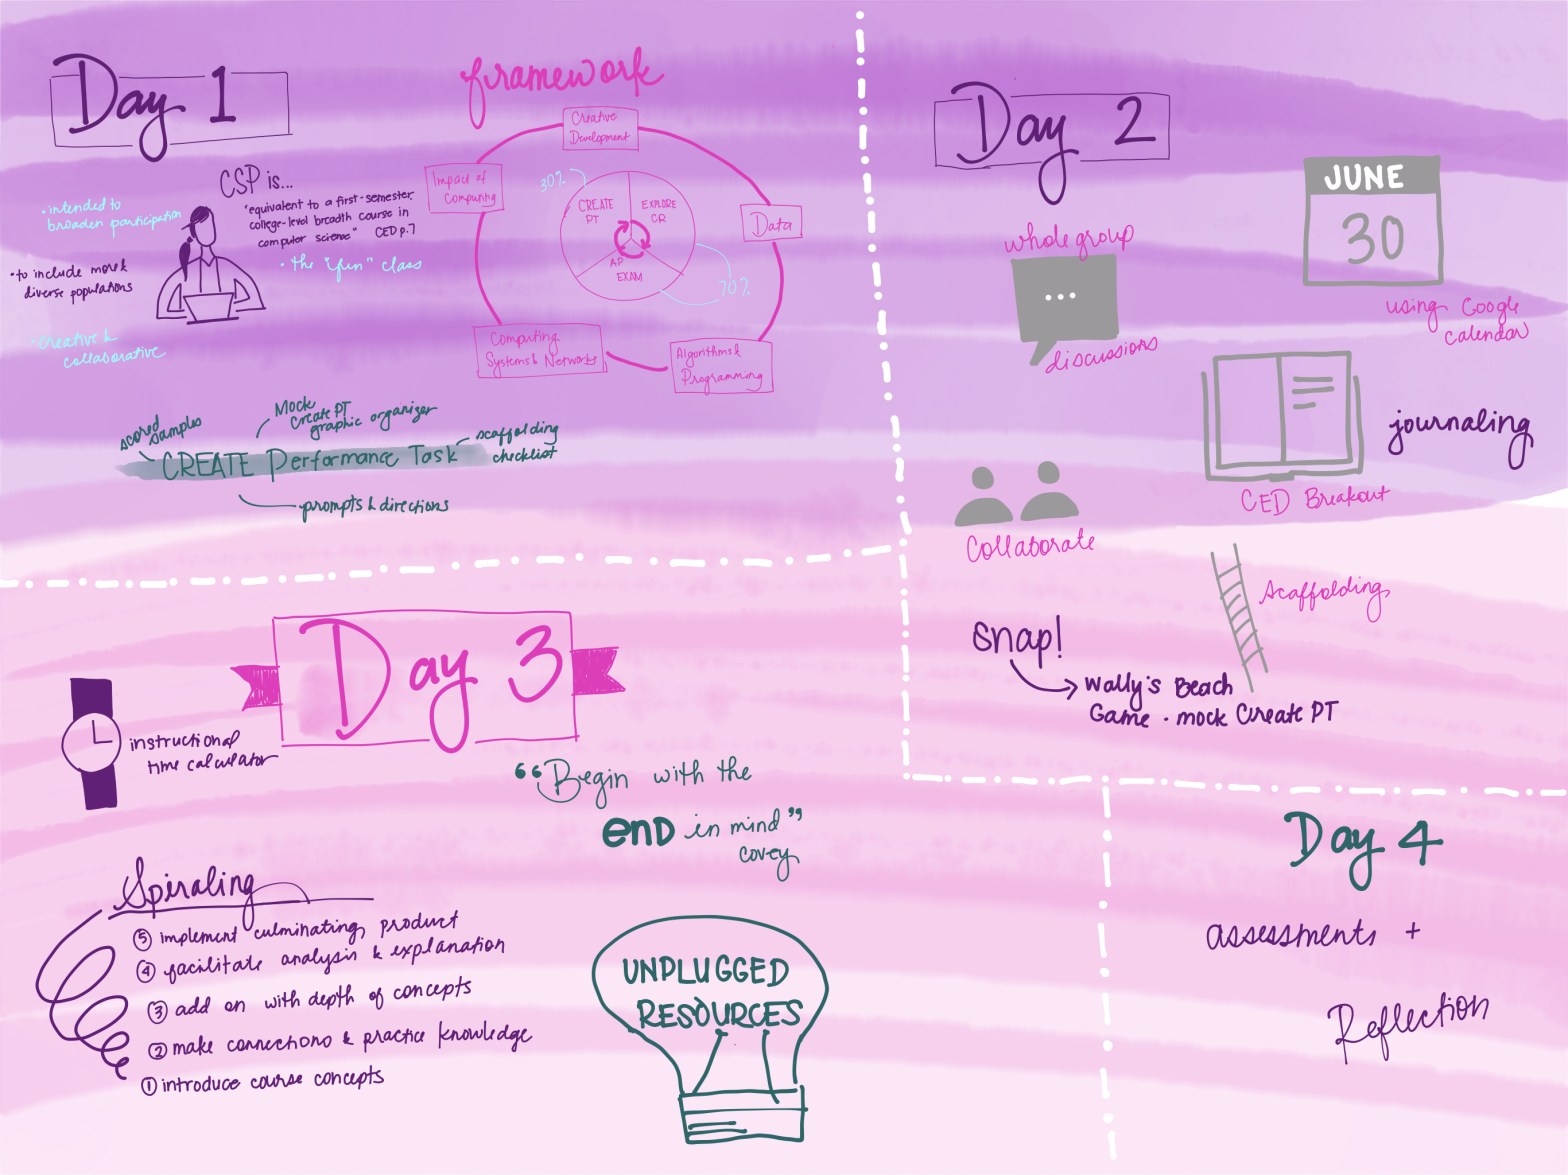
Day 1: June 29– Course & Exam Description
Jill gave us a wealth of information on the first day. We talked about the new binder we all got in the mail + conceptual framework + Computational Thinking Practices (CTP) + Big Ideas + new requirements. So yes, there was a lot of information. I’m looking over my notes, and it looks like there are a ton of holes I need to fill in. My favorite part of this day was getting a list of the vocabulary Jill uses that were pulled out from the CED and how to think about the Create PT directions. As a group, we created a list of some requirements and tips on approaching the Create PT.
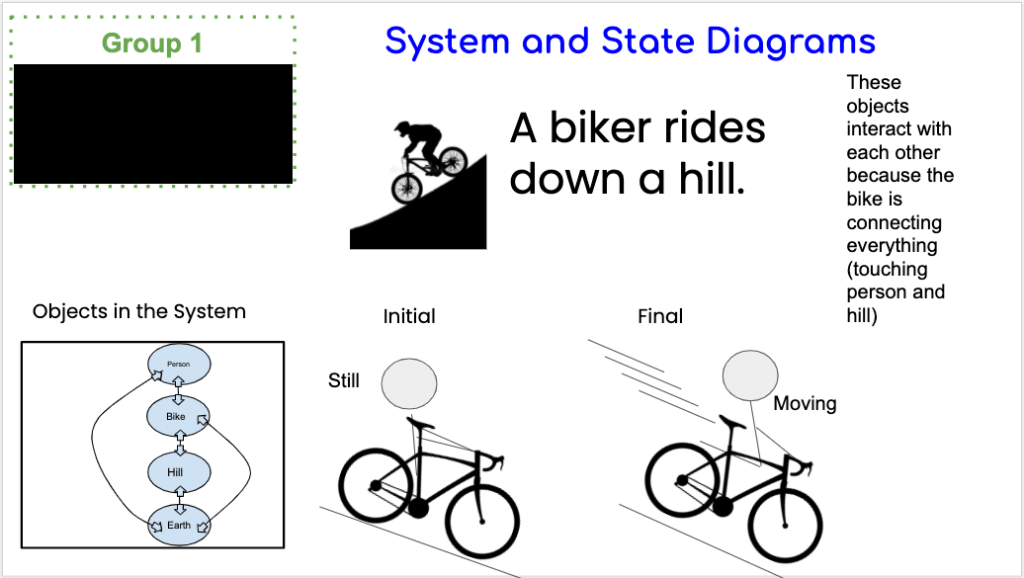
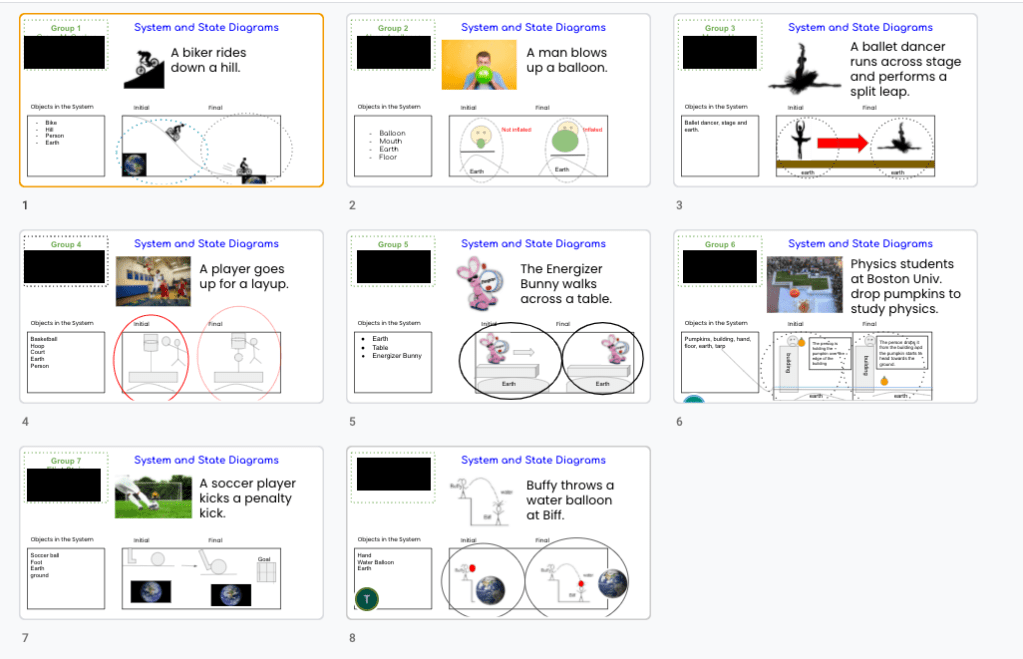
Day 2: June 30- Teaching- Create PT
We went through the new format for Create PT by completing a mock Create PT. We coded together using Snap! and then went into breakout rooms to fill out the graphic organizer provided as a group. This is where I had come to Jesus moment about being more involved in teaching programming (and not relying on CodeHS to do it for me). There would be a heavier emphasis on procedural abstraction and technical writing. When I learned to code, it was mostly like playing an instrument by ear. I could figure stuff out for the most part, but I didn’t have the language to go with it. Now, here I am teaching music theory (so to speak) without the vocabulary. I will be working on this so that I can help the students with their technical writing more effectively.
Day 3: July 1- Planning & Teaching
We unpacked the Conceptual Framework together and took a hard look at what was necessary in the course (and which lessons could be thrown out). Because we’re teaching in a blended schedule, I only see the CSP students once a week. Eek! This means our in-person (if we ever go back to being F2F) will need to be valued even more. This also means I may have to create my own videos for the students in explaining what’s happening in their programs.
Jill showed us how to lesson plan using Google calendar. While it might initially be not so exciting thing to say, SEEING the units on the calendar made it very clear how to approach the course. She’s sold me forever in using the calendar to do my lesson planning rather than trying to come up with some other cute template that I’ll only use for part of the year. However, I look at my calendar EVERY.SINGLE.DAY.
Day 4: July 2- Assessing Student Progress
Jill presented assessment syntax that I whole-heartedly appreciated. The rest of the group gave ideas jumped in and we started building ideas of how we can assess students. I think at some point here, I definitely spaced out. I wrote down a lot of stuff and I see all the notes, but I do not have a recollection of what happened.
KEY TAKEAWAYS:
- interactive journals- when I taught middle school, I used to have my students keep a math and science interactive notebook. Students would come back and tell me how it’s basically their survival guide to high school science and algebra. I will need to figure out a way to use this for computer science
- unplugged activities- Teaching at a 1:1 school, I have zero worries about our digitally native students learning how to use their tools. However, I have found it challenging to teach them without their devices. I will need to include more teaching time away from their devices and interacting with each other.


You must be logged in to post a comment.