

Day 1 of Building- Students mainly counted their LEGO pieces. The reason we do this is so that students know how many pieces they have and have discussions of how they can use certain pieces that didn’t initially show up in their Plan phase.
This is one of the videos created by the students to document how far they’ve come after Day 1.
For each day of the build, students are required to come up with a log using Google docs and a video of them working. The video is to show that one person didn’t dominate the group and take over all building responsibilities. So far the logs haven’t been that interesting. One group decided to have chat in it.
Overall, the builds seem to be going pretty well. Here are some photos of their builds on Day 1:
Some of the builds look very different from the initial building date. Part of the assignment was to use ALL of the pieces. They were purposely kept from them so that they can problem-solve along the way. I think that this form of problem-solving is kind of superficial, and somehow, if I were a student it might make me feel like I’ve been cheated somehow. However, in the past years, when the pieces were given and they were given the same assignment, the kind of planning that happened this year didn’t happen. In fact, most of the students in the past ended up building using all of the pieces, and then drew their plans after…which totally defeats the purpose of planning your building. Anyway, here are some of the structures after Day 4 of building:
This is one of my most favorite units to do in class because the students really talk to each other and are having serious problem-solving conversations throughout the whole thing. There seems to be more modern art sculptures that are showing up in their builds. I can safely assume it’s because some of the more oddly shaped pieces weren’t anticipated.
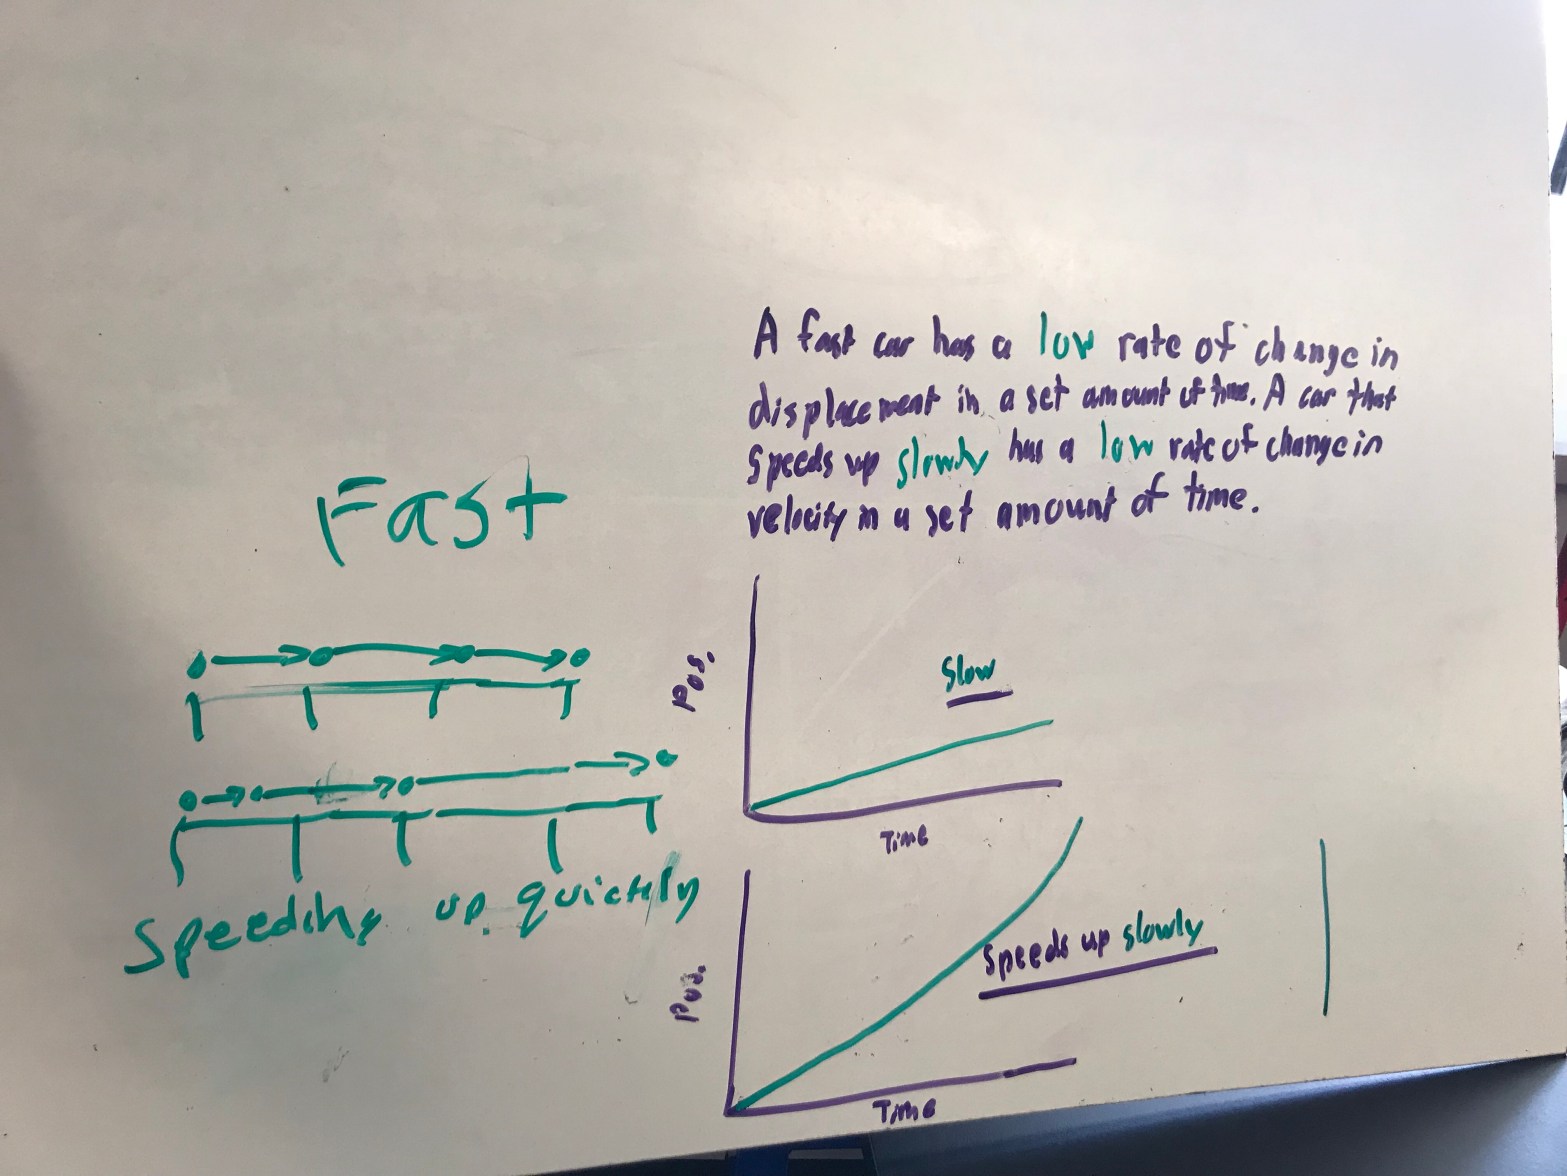

 In this first picture, students wanted to outdo their classmates and drew a graph instead of a motion map or whatever else. So they drew a position-time graph that had a horizontal line that represented fast, and one with a slope that represented speeding up quickly. When we presented, the other students didn’t seem to think there was anything wrong with their thinking…because they all thought it was right. One group, however thought that it was wrong, but they just didn’t know why. After more arguing, a student raised his hand and finally said what this picture meant.
 Before I took the photo, the student erased what she wrote for Fast because it was wrong, even though I encouraged her to just correct it in a different color. For the line “Fast,” they drew the same sized arrows with different velocities written on top. So it seems that the students substituted time values with velocity. Underneath, speeding up quickly meant that the increase of speed increased with each second. Rather than increasing speed at a constant rate, it increased speed at an increasing rate. That was really hard for me to explain how it was not acceleration (open to feedback!).




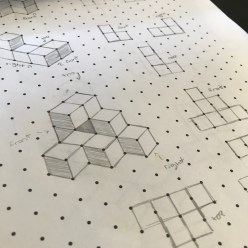 This time around, everyone seems to be doing much better. The lines are straighter and it’s beginning to look more like the 3D models. At first our lines were going in different directions and made it difficult to see the models, but after some practicing, it looks great! They’re also having an easier time seeing the front, right side, and top views from the isometric drawings. I like that they’re collaborating together and checking each other’s work.


 Learning with Ms. Medrano
You must be logged in to post a comment.